EasyJet 2014 Annual Report Download - page 11
Download and view the complete annual report
Please find page 11 of the 2014 EasyJet annual report below. You can navigate through the pages in the report by either clicking on the pages listed below, or by using the keyword search tool below to find specific information within the annual report.-
 1
1 -
 2
2 -
 3
3 -
 4
4 -
 5
5 -
 6
6 -
 7
7 -
 8
8 -
 9
9 -
 10
10 -
 11
11 -
 12
12 -
 13
13 -
 14
14 -
 15
15 -
 16
16 -
 17
17 -
 18
18 -
 19
19 -
 20
20 -
 21
21 -
 22
22 -
23
-
24
-
25
-
26
-
27
-
28
-
29
-
30
-
31
-
32
-
33
-
34
-
35
-
36
-
37
-
38
-
39
-
40
-
41
-
42
-
43
-
44
-
45
-
46
-
47
-
48
-
49
-
50
-
51
-
52
-
53
-
54
-
55
-
56
-
57
-
58
-
59
-
60
-
61
-
62
-
63
-
64
-
65
-
66
-
67
-
68
-
69
-
70
-
71
-
72
-
73
-
74
-
75
-
76
-
77
-
78
-
79
-
80
-
81
-
82
-
83
-
84
-
85
-
86
-
87
-
88
-
89
-
90
-
91
-
92
-
93
-
94
-
95
-
96
-
97
-
98
-
99
-
100
-
101
-
102
-
103
-
104
-
105
-
106
-
107
-
108
-
109
-
110
-
111
-
112
-
113
-
114
-
115
-
116
-
117
-
118
-
119
-
120
-
121
-
122
-
123
-
124
-
125
-
126
-
127
-
128
-
129
-
130
-
131
-
132
-
133
-
134
-
135
-
136
-
137
-
138
-
139
-
140
 |
 |

www.easyJet.com 9
Strategic report
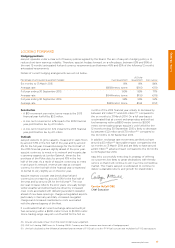
Highlights
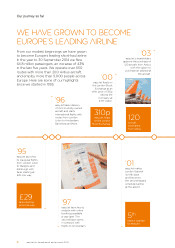
£581m
Profit before tax
(2013: £478m)
20.5%
ROCE
(2013: 17.4%)
45.4
pence per share
Proposed ordinary dividend
(2013: 33.5 pence per share)
FINANCIAL PERFORMANCE
easyJet delivered record profit before tax of £581
million, an increase of £103 million from 2013 with
a profit before tax margin of 12.8%. Profit before
tax per seat rose by £1.09 year-on-year to £8.12.
Return on capital employed grew by 3.1 percentage
points to 20.5%(1). In light of the continued strong financial
performance and confidence in the future, the Board
has decided to increase the ordinary dividend pay-out
ratio from one third of profit after tax to 40% of profit after
tax, which has resulted in a 35.5% increase in the ordinary
dividend from 33.5 pence per share to 45.4 pence per share.
The performance in the year was driven by:
• continued revenue per seat growth in a higher
capacity environment;
• a 1.3 percentage point improvement in the load factor;
• continued digital and data initiatives;
• better than expected cost performance driven by the
easyJet lean programme, one-off benefits of the CFM
engine selection and the continued scale advantages
of increasing the proportion of A320 aircraft in the fleet;
and
• rigorous focus on capital allocation and returns with
continued strategy of allocating aircraft to highest
returning parts of the network.
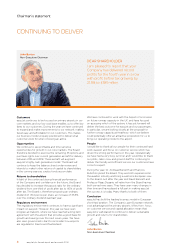
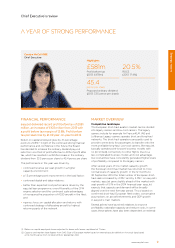
Chief Executive’s review
A year of strong performance
Carolyn McCall OBE
Chief Executive
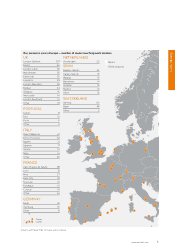
MARKET OVERVIEW
Competitive landscape
The European short-haul aviation market can be divided
into legacy carriers and low-cost carriers. The legacy
carriers include for example Air France-KLM, IAG and
Lufthansa. Legacy carriers operate short and long-haul
networks. The short-haul operations are partly used to
provide connectivity for passengers to transfer onto the
more profitable long-haul. Low-cost carriers, like easyJet,
typically operate point-to-point business models with
no (or limited) connectivity to other flights. Due to a
less complicated business model, and cost advantage,
low-cost airlines have consistently generated higher levels
of profitability compared to the legacy carriers.
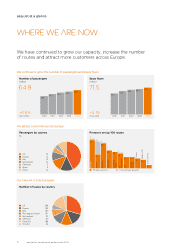
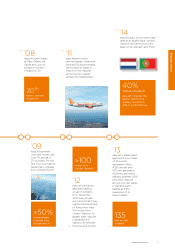
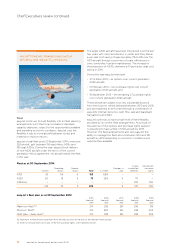
After several years of low market capacity growth
the European short-haul market has returned to more
normal levels of capacity growth. In the 12 months to
30 September 2014 the total number of European short-
haul seats increased by 4.3%(2) and by 3.0%(2) on easyJet’s
markets. easyJet grew slightly ahead of the market with
seat growth of 5.1% in the 2014 financial year. easyJet
expects that capacity and demand will be broadly
aligned over the next five-year period. This is based on
confirmed short-haul European fleet orders, conservative
assumptions on aircraft retirements and GDP growth
in easyJet’s main markets.
Several airlines have launched initiatives to improve
profitability, rationalise capacity and reduce costs. In some
cases these airlines have also been dependent on external
(1) Return on capital employed shown adjusted for leases with leases capitalised at 7 times.
(2) Capacity and market share figures from OAG. Size of European market based on internal easyJet definition. Historical data based
on 12 month period from October 2013 to September 2014.