EasyJet 2014 Annual Report Download - page 21
Download and view the complete annual report
Please find page 21 of the 2014 EasyJet annual report below. You can navigate through the pages in the report by either clicking on the pages listed below, or by using the keyword search tool below to find specific information within the annual report.-
 1
1 -
2
-
3
-
4
-
5
-
6
-
7
-
8
-
9
-
10
-
 11
11 -
 12
12 -
 13
13 -
 14
14 -
 15
15 -
 16
16 -
 17
17 -
 18
18 -
 19
19 -
 20
20 -
 21
21 -
 22
22 -
 23
23 -
 24
24 -
 25
25 -
 26
26 -
 27
27 -
 28
28 -
 29
29 -
 30
30 -
 31
31 -
32
-
33
-
34
-
35
-
36
-
37
-
38
-
39
-
40
-
41
-
42
-
43
-
44
-
45
-
46
-
47
-
48
-
49
-
50
-
51
-
52
-
53
-
54
-
55
-
56
-
57
-
58
-
59
-
60
-
61
-
62
-
63
-
64
-
65
-
66
-
67
-
68
-
69
-
70
-
71
-
72
-
73
-
74
-
75
-
76
-
77
-
78
-
79
-
80
-
81
-
82
-
83
-
84
-
85
-
86
-
87
-
88
-
89
-
90
-
91
-
92
-
93
-
94
-
95
-
96
-
97
-
98
-
99
-
100
-
101
-
102
-
103
-
104
-
105
-
106
-
107
-
108
-
109
-
110
-
111
-
112
-
113
-
114
-
115
-
116
-
117
-
118
-
119
-
120
-
121
-
122
-
123
-
124
-
125
-
126
-
127
-
128
-
129
-
130
-
131
-
132
-
133
-
134
-
135
-
136
-
137
-
138
-
139
-
140
 |
 |
www.easyJet.com 19
Strategic report
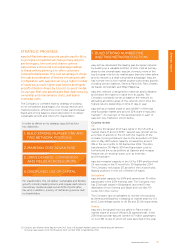
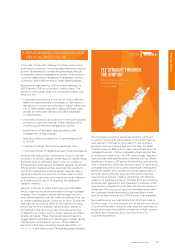
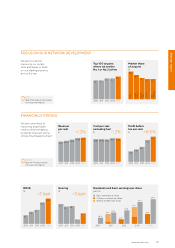
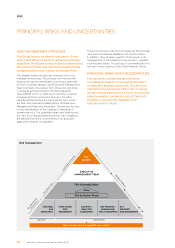
FINANCIALLY STRONG
FOCUS ON OUR NETWORK DEVELOPMENT
We are focused on
improving our routes,
slots and bases to build
on our leading presence
across Europe.
We are committed to
improving shareholder
returns whilst remaining
prudently financed with a
strong, liquid balance sheet.
9-17
See Chief Executive’s review
for more information
20-27
See the Financial review
for more information
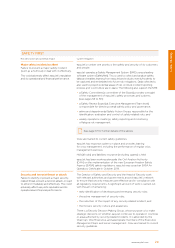
Market share
of airports
%
43
London
Luton
56
Basel
49
London
Gatwick
41 41
Geneva
Milan
Malpensa
Top 100 airports
where we are the
No.1 or No.2 airline
19
2010 2011 2012 2013 2014
19
21 21
23
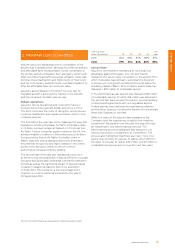
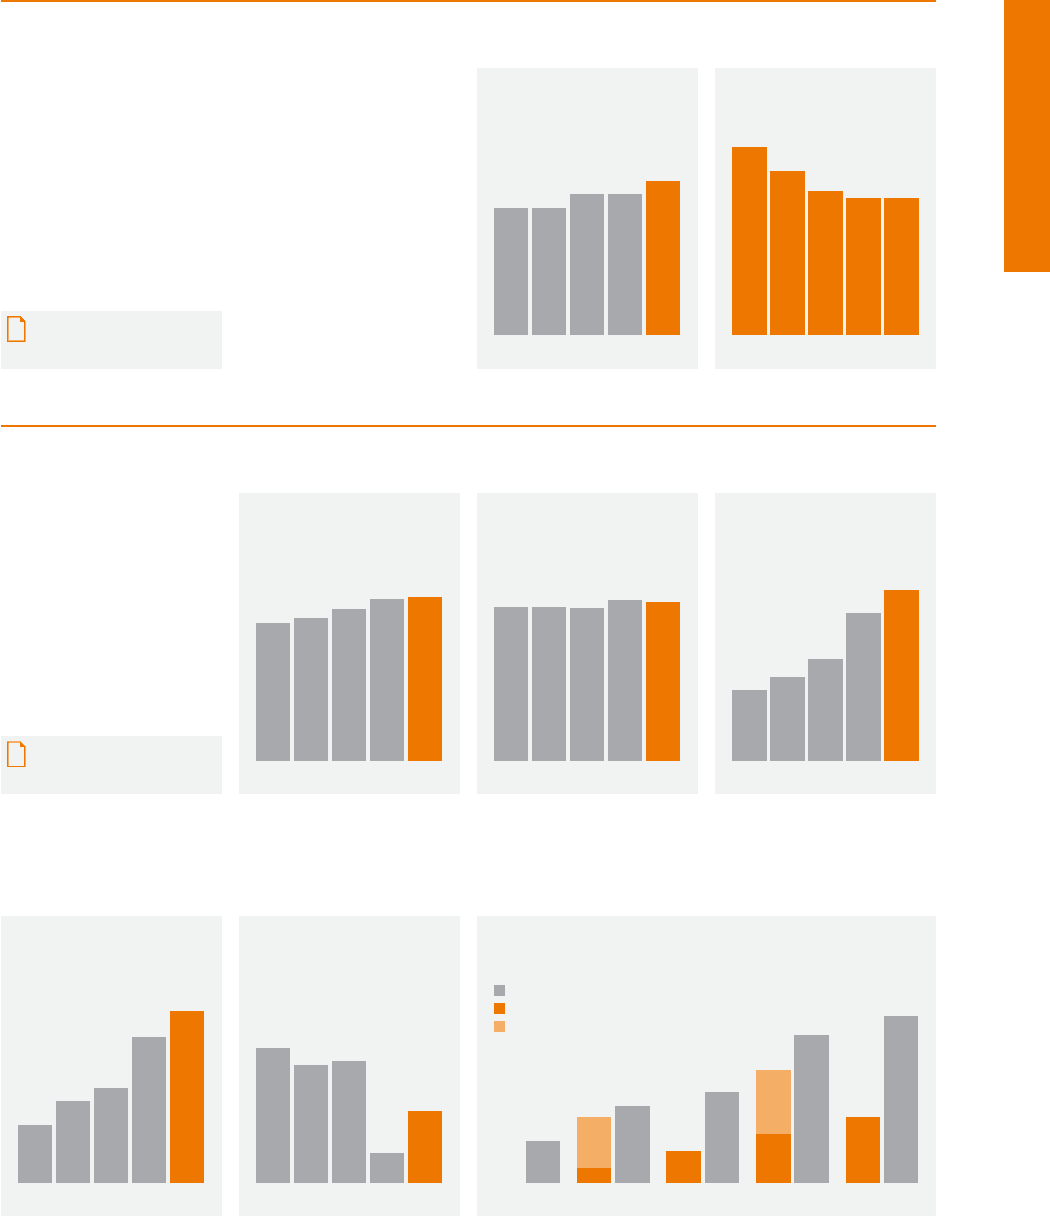
Revenue
per seat
£
53.07 55.27 58.51 62.58 63.31
2010 2011 2012 2013 2014
+1.2%
Cost per seat
excluding fuel
£
36.62
2010 2011 2012 2013 2014
36.62 36.25 38.17 37.70
-1.2%
ROCE
%
6.9
2010 2011 2012 2013 2014
9.8
11.3
17.4
20.5
+3.1ppt
Gearing
%
32
2010 2011 2012 2013 2014
28 29
7
17
+10ppt
3.36
2010 2011 2012 2013 2014
3.97
4.81
7.03
8.12
+15.6%
Profit before
tax per seat
£
Dividends and basic earnings per share
pence
2010 2011 2012 2013 2014
Basic earnings per share
Ordinary dividend per share
Special dividend per share
28.4
45.4 52.5
21.5
62.5
77.6
101.3
45.4
114.5