EasyJet 2014 Annual Report Download - page 22
Download and view the complete annual report
Please find page 22 of the 2014 EasyJet annual report below. You can navigate through the pages in the report by either clicking on the pages listed below, or by using the keyword search tool below to find specific information within the annual report.-
 1
1 -
2
-
3
-
4
-
5
-
6
-
7
-
8
-
9
-
10
-
11
-
 12
12 -
 13
13 -
 14
14 -
 15
15 -
 16
16 -
 17
17 -
 18
18 -
 19
19 -
 20
20 -
 21
21 -
 22
22 -
 23
23 -
 24
24 -
 25
25 -
 26
26 -
 27
27 -
 28
28 -
 29
29 -
 30
30 -
 31
31 -
 32
32 -
33
-
34
-
35
-
36
-
37
-
38
-
39
-
40
-
41
-
42
-
43
-
44
-
45
-
46
-
47
-
48
-
49
-
50
-
51
-
52
-
53
-
54
-
55
-
56
-
57
-
58
-
59
-
60
-
61
-
62
-
63
-
64
-
65
-
66
-
67
-
68
-
69
-
70
-
71
-
72
-
73
-
74
-
75
-
76
-
77
-
78
-
79
-
80
-
81
-
82
-
83
-
84
-
85
-
86
-
87
-
88
-
89
-
90
-
91
-
92
-
93
-
94
-
95
-
96
-
97
-
98
-
99
-
100
-
101
-
102
-
103
-
104
-
105
-
106
-
107
-
108
-
109
-
110
-
111
-
112
-
113
-
114
-
115
-
116
-
117
-
118
-
119
-
120
-
121
-
122
-
123
-
124
-
125
-
126
-
127
-
128
-
129
-
130
-
131
-
132
-
133
-
134
-
135
-
136
-
137
-
138
-
139
-
140
 |
 |

20 easyJet plc Annual report and accounts 2014
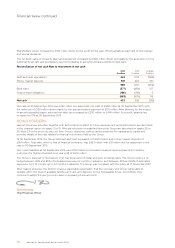
Financial review
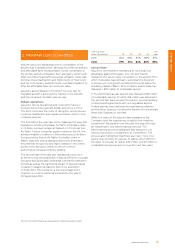
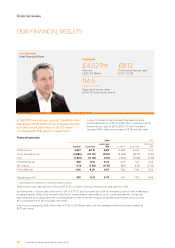
Our financial results
In the 2014 financial year, easyJet flew 64.8 million
passengers (2013: 60.8 million) and grew revenue
by 6.3% from £4,258 million to £4,527 million,
compared with 5.1% growth in seats flown.
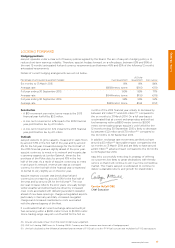
Chris Kennedy
Chief Financial Officer
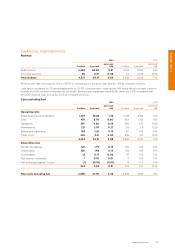
Financial overview
2014 2013
£ million £ per seat
pence per
ASK £ million £ per seat
pence per
ASK
Total revenue 4,527 63.31 5.69 4,258 62.58 5.74
Costs excluding fuel (2,695) (37.70) (3.39) (2,598) (38.17) (3.51)
Fuel (1,251) (17.49) (1.57) (1,182) (17.38) (1.59)
Profit before tax 581 8.12 0.73 478 7.03 0.64
Tax charge (131) (1.83) (0.16) (80) (1.18) (0.10)
Profit after tax 450 6.29 0.57 398 5.85 0.54
Operating profit* 581 8.12 0.73 497 7.30 0.66
* Operating profit represents profit before interest and tax.
Total revenue per seat grew by 1.2% to £63.31. At constant currency, revenue per seat grew by 1.9%.
Excluding fuel, cost per seat reduced by 1.2% to £37.70, but increased by 0.6% at constant currency, with inflationary
increases largely offset by a one-off reduction in engine heavy maintenance costs, continued delivery of easyJet
lean initiatives (including improved contractual terms with a number of ground handlers), and lower de-icing costs
as a consequence of an unusually mild winter.
Fuel costs increased by £69 million, from £17.38 to £17.49 per seat, with the average effective fuel price stable at
$977 per tonne.
A good cost performance meant that easyJet grew
profit before tax by 21.5% to £581 million, resulting in profit
before tax per seat of £8.12 (2013: £7.03). Profit after
tax was £450 million, an increase of 13.1% over last year.
Highlights
£4,527m
Revenue
(2013: £4,258m)
£8.12
Profit before tax per seat
(2013: £7.03)
114.5
pence per share
Basic earnings per share
(2013: 101.3 pence per share)