Classmates.com 2003 Annual Report Download - page 70
Download and view the complete annual report
Please find page 70 of the 2003 Classmates.com annual report below. You can navigate through the pages in the report by either clicking on the pages listed below, or by using the keyword search tool below to find specific information within the annual report.-
 1
1 -
2
-
3
-
4
-
5
-
6
-
7
-
8
-
9
-
10
-
11
-
12
-
13
-
14
-
15
-
16
-
17
-
18
-
19
-
20
-
21
-
22
-
23
-
24
-
25
-
26
-
27
-
28
-
29
-
30
-
31
-
32
-
33
-
34
-
35
-
36
-
37
-
38
-
39
-
40
-
41
-
42
-
43
-
44
-
45
-
46
-
47
-
48
-
49
-
50
-
51
-
52
-
53
-
54
-
55
-
56
-
57
-
58
-
59
-
 60
60 -
 61
61 -
 62
62 -
 63
63 -
 64
64 -
 65
65 -
 66
66 -
 67
67 -
 68
68 -
 69
69 -
 70
70 -
 71
71 -
 72
72 -
 73
73 -
 74
74 -
 75
75 -
 76
76 -
 77
77 -
 78
78 -
 79
79 -
 80
80 -
81
-
82
-
83
-
84
-
85
-
86
-
87
-
88
-
89
-
90
-
91
 |
 |

F-36
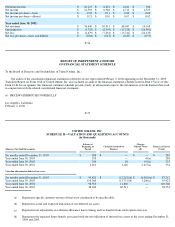
REPORT OF INDEPENDENT AUDITORS
ON FINANCIAL STATEMENT SCHEDULE
To the Board of Directors and Stockholders of United Online, Inc.:
Our audits of the consolidated financial statements referred to in our report dated February 2, 2004 appearing in the December 31, 2003
Transition Report on Form 10-K of United Online, Inc. also included an audit of the financial statement schedule listed in Item 15(a)(2) of this
Form 10-K. In our opinion, this financial statement schedule presents fairly, in all material respects, the information set forth therein when read
in conjunction with the related consolidated financial statements.
/s/ PRICEWATERHOUSECOOPERS LLP
Los Angeles, California
February 2, 2004
F-37
UNITED ONLINE, INC.
SCHEDULE II—VALUATION AND QUALIFYING ACCOUNTS
(in thousands)
(a)
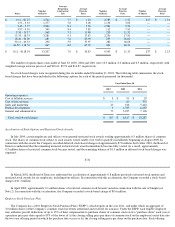
Operating income
$
10,223
$
6,631
$
4,161
$
706
Net income
$
14,594
$
6,962
$
4,711
$
1,525
Net income per share
—
basic
$
0.23
$
0.11
$
0.08
$
0.03
Net income per share
—
diluted
$
0.21
$
0.10
$
0.07
$
0.02
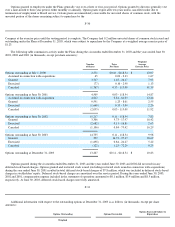
Year ended June 30, 2002:
Net revenues
$
54,449
$
50,911
$
48,047
$
14,108
Operating loss
$
(3,723
)
$
(8,394
)
$
(17,328
)
$
(24,501
)
Net loss
$
(2,679
)
$
(7,254
)
$
(15,742
)
$
(22,135
)
Net loss per share
—
basic and diluted
$
(0.04
)
$
(0.12
)
$
(0.27
)
$
(0.57
)
Allowance for doubtful accounts
Balance at
Beginning of
Period
Charged/(Credited) to
Expense
Charges
Utilized/ Write
offs
Balance at End of
Period
Six months ended December 31, 2003
$
288
$
—
$
—
$
288
Year ended June 30, 2003
333
—
45
(a)
288
Year ended June 30, 2002
354
98
119
(a)
333
Year ended June 30, 2001
1,651
1,120
2,417
(a)
354
Valuation allowance for deferred tax assets
Six months ended December 31, 2003
$
95,423
$
(12,292
)(d)
$
(4,081
)(e)
$
87,212
Year ended June 30, 2003
110,360
(13,731
)(b)
1,206
(c)
95,423
Year ended June 30, 2002
98,554
11,806
—
110,360
Year ended June 30, 2001
38,043
60,511
—
98,554
Represents specific amounts written off that were considered to be uncollectible.
(b) Represents actual and expected utilization of net deferred tax assets.
(c) Represents net adjustments in valuation allowance due to timing and tax benefits from stock option exercises.
(d)
Represents the expected future benefit associated with the net utilization of deferred tax assets in the years ending December 31,
2004 and 2005.