Classmates.com 2003 Annual Report Download - page 12
Download and view the complete annual report
Please find page 12 of the 2003 Classmates.com annual report below. You can navigate through the pages in the report by either clicking on the pages listed below, or by using the keyword search tool below to find specific information within the annual report.
Dividends
We have never declared or paid any cash dividends on our capital stock.
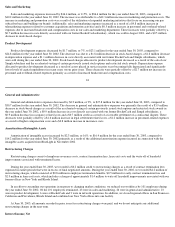
ITEM 6. SELECTED FINANCIAL DATA
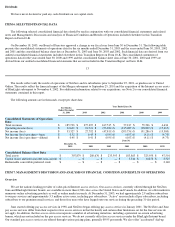
The following selected consolidated financial data should be read in conjunction with our consolidated financial statements and related
notes and Management's Discussion and Analysis of Financial Condition and Results of Operations included elsewhere in this Transition
Report on Form 10-K.
On December 18, 2003, our Board of Directors approved a change in our fiscal year from June 30 to December 31. The following table
presents the consolidated statements of operations data for the six months ended December 31, 2003 and the years ended June 30, 2003, 2002
and 2001 and the consolidated balance sheet data at December 31, 2003 and June 30, 2003 and 2002. Such financial data are derived from our
audited consolidated financial statements included elsewhere in this Transition Report on Form 10-K. The consolidated statements of
operations data for the years ended June 30, 2000 and 1999 and the consolidated balance sheet data at June 30, 2001, 2000 and 1999 are
derived from our audited consolidated financial statements that are not included in this Transition Report on Form 10-K.
13
The results reflect only the results of operations of NetZero and its subsidiaries prior to September 25, 2001, as predecessor to United
Online. The results reflect the financial impact of the Merger subsequent to September 25, 2001 and the acquisition of the Internet access assets
of BlueLight subsequent to November 4, 2002. For additional information related to our acquisitions, see Note 2 to our consolidated financial
statements contained in this report.
The following amounts are in thousands, except per share data:
ITEM 7. MANAGEMENT'S DISCUSSION AND ANALYSIS OF FINANCIAL CONDITION AND RESULTS OF OPERATIONS
Overview
We are the nation's leading provider of value-priced Internet access services. Our access services, currently offered through the NetZero,
Juno and BlueLight Internet brands, are available in more than 6,500 cities across the United States and Canada. In addition, we offer marketers
numerous online advertising products as well as online market research. At December 31, 2003, we had approximately 2.9 million subscribers
to our pay services and approximately 5.3 million active users, including pay subscribers. "Active" users include all pay subscribers, including
subscribers to our premium email services, and those free users who have logged onto our services during the preceding 31-day period.
Juno started offering pay access services in 1998, and NetZero began offering pay access services in January 2001. The NetZero and Juno
pay access services differ from their respective free access services in that the hourly and certain other limitations set for the free services do
not apply. In addition, the free access services incorporate a number of advertising initiatives, including a persistent on-screen advertising
banner, which are not included on the pay access services. We do not currently offer free access services under the BlueLight Internet brand.
Our standard pay access services are offered through various pricing plans, generally $9.95 per month. We also offer "accelerated" dial
-
up
Six Months
Ended December
31, 2003
Year Ended June 30,
2003
2002
2001
2000
1999
Consolidated Statements of Operations
Data:
Total revenues
$
185,738
$
277,295
$
167,515
$
57,217
$
55,506
$
4,634
Operating income (loss)
$
32,639
$
21,721
$
(53,946
)
$
(215,087
)
$
(98,099
)
$
(15,415
)
Net income (loss)
$
33,327
$
27,792
$
(47,810
)
$
(205,756
)
$
(91,286
)
$
(15,300
)
Net income (loss) per share
—
basic
$
0.52
$
0.45
$
(0.90
)
$
(6.03
)
$
(4.11
)
$
(4.73
)
Net income (loss) per share
—
diluted
$
0.48
$
0.41
$
(0.90
)
$
(6.03
)
$
(4.11
)
$
(4.73
)
June 30,
December 31,
2003
2003
2002
2001
2000
1999
Consolidated Balance Sheet Data:
Total assets
$
307,879
$
280,676
$
233,593
$
183,863
$
325,958
$
47,501
Capital leases and notes payable, non
-
current
$
—
$
—
$
—
$
3,314
$
10,278
$
3,527
Redeemable convertible preferred stock
$
—
$
—
$
—
$
—
$
—
$
2,140


