Classmates.com 2003 Annual Report Download - page 19
Download and view the complete annual report
Please find page 19 of the 2003 Classmates.com annual report below. You can navigate through the pages in the report by either clicking on the pages listed below, or by using the keyword search tool below to find specific information within the annual report.-
 1
1 -
2
-
3
-
4
-
5
-
6
-
7
-
8
-
 9
9 -
 10
10 -
 11
11 -
 12
12 -
 13
13 -
 14
14 -
 15
15 -
 16
16 -
 17
17 -
 18
18 -
 19
19 -
 20
20 -
 21
21 -
 22
22 -
 23
23 -
 24
24 -
 25
25 -
 26
26 -
 27
27 -
 28
28 -
 29
29 -
30
-
31
-
32
-
33
-
34
-
35
-
36
-
37
-
38
-
39
-
40
-
41
-
42
-
43
-
44
-
45
-
46
-
47
-
48
-
49
-
50
-
51
-
52
-
53
-
54
-
55
-
56
-
57
-
58
-
59
-
60
-
61
-
62
-
63
-
64
-
65
-
66
-
67
-
68
-
69
-
70
-
71
-
72
-
73
-
74
-
75
-
76
-
77
-
78
-
79
-
80
-
81
-
82
-
83
-
84
-
85
-
86
-
87
-
88
-
89
-
90
-
91
 |
 |

22
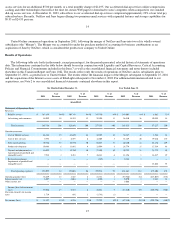
factors, including the Merger in September 2001, which increased our pay subscriber base by over 875,000 users, a significant number of our
free users upgrading to pay services, increased marketing of our pay services and the acquisition of approximately 174,000 pay subscribers
from BlueLight in November 2002. Average monthly revenue per pay subscriber was $9.71 for the year ended June 30, 2003, compared to
$12.26 for the year ended June 30, 2002. Average monthly revenue per pay subscriber was abnormally high in the year ended June 30, 2002 as
a result of the timing of the Merger.
Advertising and Commerce Revenues
Advertising and commerce revenues increased by $3.0 million, or 11%, to $29.5 million for the year ended June 30, 2003, compared to
$26.5 million for the year ended June 30, 2002. The increase was primarily due to higher advertising revenues generated from our advertising
agreement with GM and a significant increase in revenues from fees derived from our Internet search partners. We derived approximately 37%
of our advertising and commerce revenues for the year ended June 30, 2003 from GM, compared to approximately 34% for the year ended
June 30, 2002. Additionally, we derived approximately 20% of our advertising and commerce revenues for the year ended June 30, 2003 from
Internet search fees primarily provided through our agreement with Overture, compared to approximately 9% for the year ended June 30, 2002.
The increased revenues from GM and Overture were partially offset by a decrease in advertising inventory available for sale as a result of a
decrease in our active free user base and the use of available inventory for the promotion of our pay services to our free users.
Cost of Billable Services
Cost of billable services increased by $15.1 million, or 20%, to $89.3 million for the year ended June 30, 2003, compared to $74.2 million
for the year ended June 30, 2002. The increase was due to a $12.1 million increase in telecommunications costs, a $3.1 million net increase in
network personnel and overhead-related costs allocated to billable services and a $1.7 million increase in customer support and billing-related
costs. These costs were partially offset by a $2.0 million decrease in network depreciation allocated to billable services. Telecommunications
costs increased as a result of an increase in the number of pay subscribers and an increase in the average usage per pay subscriber. The increase
in telecommunications hours utilized was partially offset by a 25% decrease in average hourly telecommunications costs, which decreased due
to improvements in modem port utilization, consolidation of our network data centers and better pricing obtained from our managed modem
vendors. Telecommunication hours allocated to our pay subscriber base increased to approximately 85% of total telecommunications hours
purchased during the year ended June 30, 2003, compared to approximately 63% during the year ended June 30, 2002. Network personnel and
overhead-related costs allocated to billable services increased due to the increase in telecommunications hours utilized by pay subscribers as a
percentage of total telecommunications hours purchased. Customer support and billing-related costs increased as a result of the increase in the
number of pay subscribers. Depreciation expense allocated to billable services decreased due to assets placed in service in prior years becoming
fully depreciated and significantly lower levels of capital expenditure in recent years versus prior years.
Cost of billable services as a percentage of billable services revenues was 36% in the year ended June 30, 2003, compared to 53% in the
year ended June 30, 2002. Cost of billable services as a percentage of billable services revenues decreased as a result of decreased hourly
telecommunications costs, decreased customer billing and support costs per pay subscriber and decreased depreciation expense, which were
partially offset by an increase in average hourly usage per pay subscriber. Customer billing and support costs per pay subscriber decreased as a
result of cost savings gained through the consolidation of NetZero's and Juno's customer billing and support functions, which resulted in better
pricing from our primary customer support vendor as a result of increased call volumes.
23
Cost of Free Services
Cost of free services decreased by $20.5 million, or 62%, to $12.6 million for the year ended June 30, 2003, compared to $33.1 million for
the year ended June 30, 2002. The decrease was due to a $16.6 million decrease in telecommunications costs, a $3.0 million decrease in
network depreciation allocated to free services and a $0.9 million net decrease in network personnel and overhead-related costs allocated to
free services. The decrease in telecommunications costs was a result of a decrease in average hourly telecommunications costs, a decrease in
the number of active free users and a decrease in the average hourly usage of our free users, which resulted from hourly limitations imposed on
our free services. Our active free user base consisted of approximately 2.6 million users at June 30, 2003, compared to approximately
3.1 million users at June 30, 2002. This decrease primarily resulted from free users upgrading to our pay services and fewer new users signing
up for our free services as a result of usage and geographical limitations imposed on our free services in the year ended June 30, 2002 and a
reduced emphasis on marketing our free services. Depreciation expense allocated to free services has decreased due to assets placed in service
in prior years becoming fully depreciated, significantly lower levels of capital expenditures in recent years versus prior years and a decrease in
free users as a percentage of total free users and pay subscribers. Telecommunication hours allocated to our free user base decreased to
approximately 15% of total telecommunications hours purchased during the year ended June 30, 2003, compared to approximately 37% during
the year ended June 30, 2002.