Classmates.com 2003 Annual Report Download - page 18
Download and view the complete annual report
Please find page 18 of the 2003 Classmates.com annual report below. You can navigate through the pages in the report by either clicking on the pages listed below, or by using the keyword search tool below to find specific information within the annual report.-
 1
1 -
2
-
3
-
4
-
5
-
6
-
7
-
 8
8 -
 9
9 -
 10
10 -
 11
11 -
 12
12 -
 13
13 -
 14
14 -
 15
15 -
 16
16 -
 17
17 -
 18
18 -
 19
19 -
 20
20 -
 21
21 -
 22
22 -
 23
23 -
 24
24 -
 25
25 -
 26
26 -
 27
27 -
 28
28 -
29
-
30
-
31
-
32
-
33
-
34
-
35
-
36
-
37
-
38
-
39
-
40
-
41
-
42
-
43
-
44
-
45
-
46
-
47
-
48
-
49
-
50
-
51
-
52
-
53
-
54
-
55
-
56
-
57
-
58
-
59
-
60
-
61
-
62
-
63
-
64
-
65
-
66
-
67
-
68
-
69
-
70
-
71
-
72
-
73
-
74
-
75
-
76
-
77
-
78
-
79
-
80
-
81
-
82
-
83
-
84
-
85
-
86
-
87
-
88
-
89
-
90
-
91
 |
 |

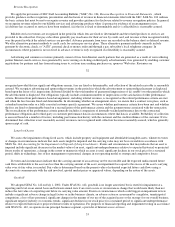
on capital leases and the amortization of premiums on certain of our short-term investments.
Interest income, net increased by $0.3 million, or 17%, to $2.4 million for the six months ended December 31, 2003, compared to
$2.1 million for the six months ended December 31, 2002. The increase in interest income, net is due to higher average cash, cash equivalent
and short-term investment balances and reduced interest expense as a result of the repayment of capital lease obligations.
Provision for Income Taxes
Our deferred tax assets, net of valuation allowance, at December 31, 2003 of $26.4 million represent the expected utilization of net
deferred tax assets through the period ended December 31, 2005. At December 31, 2002 our deferred tax assets were fully offset by valuation
allowance based upon our assessment of all available evidence.
Consistent with prior periods, in determining the need for a valuation allowance at December 31, 2003, we reviewed both positive and
negative evidence pursuant to the requirements of SFAS No. 109, Accounting for Income Taxes, including current and historical results of
operations, the annual limitation on utilization of net operating loss carryforwards pursuant to Internal Revenue Code (the "Code")
21
Section 382, future income projections and potential tax-planning strategies. Based upon our assessment of all available evidence, we
concluded that, with the exception of the net deferred tax assets that are expected to be utilized through December 31, 2005, it is not more
likely than not that the remaining deferred tax assets will be realized. This conclusion is based primarily on our history of net operating losses
as compared to only a recent trend of profitable operations, the potential for future stock option deductions to significantly reduce taxable
income, our annual net operating loss limitations under Section 382 of the Code and the need to generate significant amounts of taxable income
in future periods, on a consistent and prolonged basis, in order to utilize the remaining deferred tax assets. We will continue to monitor all
available evidence and reassess the potential realization of our deferred tax assets. If we continue to meet our financial projections and improve
our results of operations, or if circumstances otherwise change, it is reasonably possible that we may release all, or a portion, of the remaining
valuation allowance in the near term. Any such release would result in recording a tax benefit that would increase net income in the period the
allowance is released. Additionally, any such release may result in the further reduction of goodwill and intangible assets acquired in
connection with the Merger. Of the $87.2 million of valuation allowance recorded at December 31, 2003, approximately $31.9 million is
attributable to the deferred tax assets acquired in connection with the Merger.
For the six months ended December 31, 2003, we recorded a tax provision of $1.7 million on pre-tax income of $35.0 million, resulting in
an effective tax rate of 4.9%. The effective tax rate differs from the statutory tax rate primarily due to the release of valuation allowance
attributable to the expected utilization of net operating loss and tax credit carryforwards in the years ending December 31, 2004 and 2005,
offset by current California state income tax. In September 2002, the State of California enacted legislation that suspend the utilization of net
operating loss carryforwards to offset current taxable income for a two-year period beginning in the year ended June 30, 2003. As a result, we
recorded a California state income tax provision for the period.
For the six months ended December 31, 2002, we recorded a tax provision of $0.7 million on pre-tax income of $6.9 million, which
resulted in an effective tax rate of approximately 10%. The effective tax rate differs from the statutory tax rate primarily due to the actual
utilization of federal net operating loss carryforwards during the period, the benefit of which had not been previously recognized, offset by
current California state income tax due to the legislation enacted in September 2002. At December 31, 2002, based upon our assessment of all
available evidence, we determined that it was not more likely than not that we would realize the benefit of our remaining net deferred tax
assets.
At December 31, 2003, we had net operating loss and tax credit carryforwards for federal and state income tax purposes of approximately
$272 million and $324 million, respectively, which begin to expire in 2018 and 2005, respectively. These carryforwards have been adjusted to
reflect the limitations under Section 382 of the Code resulting from the Merger.
Year Ended June 30, 2003 Compared to
the Year Ended June 30, 2002
Revenues
Billable Services Revenues
Billable services revenues increased by $106.8 million, or 76%, to $247.8 million for the year ended June 30, 2003, compared to
$141.0 million for the year ended June 30, 2002. The increase was due to an increase in our average number of pay subscribers, which was
partially offset by a decrease in our average monthly revenue per pay subscriber. Our average number of pay subscribers was approximately
2,127,000 during the year ended June 30, 2003, compared to approximately 959,000 during the year ended June 30, 2002. The increase in our
average number of pay subscribers resulted from a number of