Classmates.com 2003 Annual Report Download - page 15
Download and view the complete annual report
Please find page 15 of the 2003 Classmates.com annual report below. You can navigate through the pages in the report by either clicking on the pages listed below, or by using the keyword search tool below to find specific information within the annual report.-
 1
1 -
2
-
3
-
4
-
 5
5 -
 6
6 -
 7
7 -
 8
8 -
 9
9 -
 10
10 -
 11
11 -
 12
12 -
 13
13 -
 14
14 -
 15
15 -
 16
16 -
 17
17 -
 18
18 -
 19
19 -
 20
20 -
 21
21 -
 22
22 -
 23
23 -
 24
24 -
 25
25 -
26
-
27
-
28
-
29
-
30
-
31
-
32
-
33
-
34
-
35
-
36
-
37
-
38
-
39
-
40
-
41
-
42
-
43
-
44
-
45
-
46
-
47
-
48
-
49
-
50
-
51
-
52
-
53
-
54
-
55
-
56
-
57
-
58
-
59
-
60
-
61
-
62
-
63
-
64
-
65
-
66
-
67
-
68
-
69
-
70
-
71
-
72
-
73
-
74
-
75
-
76
-
77
-
78
-
79
-
80
-
81
-
82
-
83
-
84
-
85
-
86
-
87
-
88
-
89
-
90
-
91
 |
 |

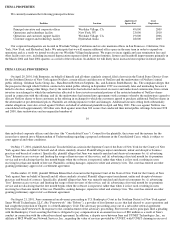
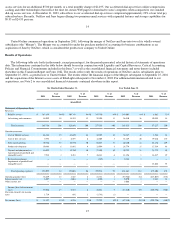
Advertising and commerce revenues increased by $3.6 million, or 25%, to $18.1 million for the six months ended December 31, 2003,
compared to $14.5 million for the six months ended December 31, 2002. The increase was primarily due to higher advertising revenues
generated from our advertising agreement with General Motors Corporation ("GM") and an increase in fees derived from our Internet search
partners. We derived approximately 44% of our advertising and commerce revenues for the six months ended December 31, 2003 from GM,
compared to approximately 36% for the six months ended December 31, 2002. The increase in advertising revenues from GM was partially a
result of a $1.5 million performance bonus earned during the September 2003 quarter. We derived approximately 21% and 19% of our
advertising and commerce revenues, respectively, for the six months ended December 31, 2003 and 2002 from Internet search fees primarily
provided through our search agreement with Overture Services, Inc. ("Overture"). In November 2003, we amended our agreement with
Overture, which included among other items an extension of the term through March 2007. As a result of the amended search agreement with
Overture, we currently anticipate that our advertising and commerce revenues derived from Internet search fees will increase.
Our agreement with GM expired in December 2003 and was not renewed. The GM agreement has not been replaced by a similar
arrangement, although we do anticipate higher search revenues from our agreement with Overture. As a result of the expiration of our GM
agreement, we may experience a decrease in advertising and commerce revenues commencing in the March 2004 quarter from the levels
achieved in the September 2003 and December 2003 quarters.
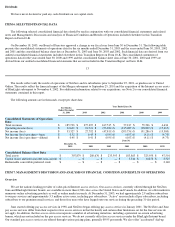
Cost of Billable Services
Cost of billable services includes direct costs of billable services and costs that have been allocated to billable services based on the
aggregate hourly usage of our pay access subscribers as a percentage of total hours used by our active users. Direct costs consist of costs related
to providing technical support, customer billing and billing support to our pay subscribers. Allocated costs consist primarily of
telecommunications and data center costs, personnel and overhead-related costs associated with operating our network and data centers, and
depreciation of network computers and equipment.
Cost of billable services increased by $3.5 million, or 8%, to $46.2 million for the six months ended December 31, 2003, compared to
$42.7 million for the six months ended December 31, 2002. The increase is due to a $2.1 million increase in customer support and billing-
related costs, a $1.3 million
17
increase in telecommunications costs and a $0.7 million increase in network personnel and overhead-
related costs allocated to billable services.
These costs were partially offset by a $0.6 million decrease in network depreciation allocated to billable services. Telecommunications costs
increased as a result of an increase in the average number of pay access subscribers, which was partially offset by a 23% decrease in average
hourly telecommunications costs and, to a lesser extent, a decrease in the average hourly usage per pay access subscriber. Our average hourly
telecommunications costs decreased as a result of better port utilization, improvements made in allocating our telecommunications usage to our
lower cost vendors and lower telecommunications prices. Telecommunications hours allocated to our pay access subscriber base increased to
approximately 90% of total telecommunications hours purchased during the six months ended December 31, 2003, compared to approximately
84% during the six months ended December 31, 2002. Network personnel and overhead-related costs allocated to billable services increased
due to the increase in telecommunications hours utilized by pay access subscribers as a percentage of total telecommunications hours
purchased. Customer support and billing-related costs increased as a result of the increase in the average number of pay access subscribers.
Depreciation expense allocated to billable services has decreased due to network assets placed in service in prior years becoming fully
depreciated and significantly lower levels of capital expenditures in recent years versus prior years.
Cost of billable services as a percentage of billable services revenues was 27.5% in the six months ended December 31, 2003, compared to
39.0% in the six months ended December 31, 2002. This decrease resulted from an increase in average monthly revenue per pay access
subscriber due to significant adoption of our accelerated dial-
up services; a decrease in average hourly telecommunications costs per pay access
subscriber; decreased customer billing and support costs per pay access subscriber as a result of better pricing obtained from our primary
customer support vendor; decreased depreciation expense; and a slight decrease in average hourly usage per pay access subscriber.
Changes in our average monthly revenue per pay subscriber and, as a result, our cost of billable services as a percentage of billable
services revenues, will be highly dependent on our mix of pay subscribers, particularly the number of accelerated dial-
up subscribers. Our costs
to service an accelerated dial-up subscriber as compared to our costs to service a subscriber of our standard dial-up services are, on average,
lower as a percentage of revenues derived from such services. As such, if we are not successful in continuing to increase our percentage of
accelerated dial-up subscribers, or if due to competitive or other factors we decrease our pricing for accelerated dial-up services, it is likely that
our cost of billable services as a percentage of billable services revenues would be adversely impacted. While our average hourly
telecommunications costs decreased, we may experience increased average hourly telecommunications costs in future periods, particularly if
we expand our service coverage to additional geographic areas where telecommunications costs are higher. Additionally, while the average
hourly usage of our pay access subscribers decreased in the six months ended December 31, 2003 compared to the six months ended
December 31, 2002, we may experience increased average hourly usage in future periods. Continued growth in the number of accelerated dial-
up subscribers may result in increased average hourly usage in the future since these subscribers have higher average monthly usage compared
to our standard dial-up access subscribers.
Cost of Free Services