Classmates.com 2003 Annual Report Download - page 16
Download and view the complete annual report
Please find page 16 of the 2003 Classmates.com annual report below. You can navigate through the pages in the report by either clicking on the pages listed below, or by using the keyword search tool below to find specific information within the annual report.-
 1
1 -
2
-
3
-
4
-
5
-
 6
6 -
 7
7 -
 8
8 -
 9
9 -
 10
10 -
 11
11 -
 12
12 -
 13
13 -
 14
14 -
 15
15 -
 16
16 -
 17
17 -
 18
18 -
 19
19 -
 20
20 -
 21
21 -
 22
22 -
 23
23 -
 24
24 -
 25
25 -
 26
26 -
27
-
28
-
29
-
30
-
31
-
32
-
33
-
34
-
35
-
36
-
37
-
38
-
39
-
40
-
41
-
42
-
43
-
44
-
45
-
46
-
47
-
48
-
49
-
50
-
51
-
52
-
53
-
54
-
55
-
56
-
57
-
58
-
59
-
60
-
61
-
62
-
63
-
64
-
65
-
66
-
67
-
68
-
69
-
70
-
71
-
72
-
73
-
74
-
75
-
76
-
77
-
78
-
79
-
80
-
81
-
82
-
83
-
84
-
85
-
86
-
87
-
88
-
89
-
90
-
91
 |
 |

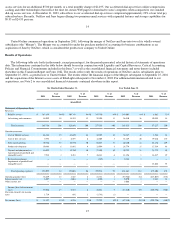
Cost of free services includes direct costs incurred in providing certain technical and customer support services to our free access users as
well as costs that have been allocated to free services based on the aggregate hourly usage of our free access users as a percentage of total hours
used by our active access users. Allocated costs consist primarily of telecommunications and data center costs, personnel and overhead-related
costs associated with operating our network and data centers, and depreciation of network computers and equipment.
18
Cost of free services decreased by $2.9 million, or 43%, to $4.0 million for the six months ended December 31, 2003, compared to
$6.9 million for the six months ended December 31, 2002. The decrease was due to a $2.4 million decrease in telecommunications costs, a
$0.3 million decrease in network depreciation allocated to free services, a $0.1 million decrease in customer support costs allocated to free
services and a $0.1 million decrease in network personnel and overhead-related costs allocated to cost of free services. The decrease in
telecommunications costs is a result of a decrease in average hourly telecommunications costs, a decrease in the number of active free access
users and a decrease in the average hourly usage of our free access users. Our active free access user base consisted of approximately
2.4 million users at December 31, 2003, compared to approximately 2.8 million users at December 31, 2002. This decrease in active free access
users has resulted primarily from active free access users upgrading to our pay services and fewer new users signing up for our free access
services. Depreciation expense allocated to free access services has decreased due to assets placed in service in prior years becoming fully
depreciated, significantly lower levels of capital expenditures in recent years versus prior years and a decrease in free access users as a
percentage of total active access users. Telecommunications hours allocated to our free access user base decreased to approximately 10% of
total telecommunications hours purchased during the six months ended December 31, 2003, compared to approximately 16% during the six
months ended December 31, 2002.
Sales and Marketing
Sales and marketing expenses include advertising and promotion expenses, fees paid to distribution partners to acquire new pay
subscribers, personnel-related expenses for sales and marketing personnel and telemarketing costs incurred to acquire and retain pay
subscribers and up sell pay subscribers to add-on services, such as our accelerated dial-up and premium email services. We have expended
significant amounts on sales and marketing, including national branding campaigns comprised of television, Internet, sponsorships, radio, print
and outdoor advertising. Marketing and advertising costs to promote our products and services are expensed in the period incurred. Advertising
and promotion expenses include media, agency and promotion expenses. Media production costs are expensed the first time the advertisement
is run. Media and agency costs are expensed over the period the advertising runs.
Sales and marketing expenses increased by $34.0 million, or 93%, to $70.5 million for the six months ended December 31, 2003,
compared to $36.5 million for the six months ended December 31, 2002. The increase is primarily attributable to a $29.9 million increase in
marketing and promotion costs as a result of an expansion in marketing activities that focus on increasing our pay subscriber base, promoting
our accelerated dial-up services and building our brands. Additionally, sales and marketing expenses increased as a result of a $4.4 million
increase in telemarketing expenses related to customer acquisition, retention and up sell activities. The increases were partially offset by a
$0.2 million decrease in overhead-related costs. We expect to continue to increase our marketing expenditures in the near term by expanding
our traditional advertising efforts and our distribution channels, which may result in increased fees paid to distribution partners to acquire new
pay subscribers.
In August 2003, we entered into a three-year agreement with Best Buy Co, Inc. to distribute the NetZero and Juno pay access services in
Best Buy's channels beginning in October 2003. We are required to pay Best Buy a fee for each pay access subscriber we acquire through Best
Buy's channels. If we acquire a significant number of pay access subscribers through Best Buy, this agreement could account for a substantial
percentage of our marketing expenses in future periods.
Our marketing expenditures and the allocation of our marketing resources among our various services may vary significantly from quarter
to quarter. In the near term, we anticipate allocating a significant portion of our expenditures to our accelerated access services, which may
result in a lower number of new pay subscribers signing up for our services. Other than the Best Buy agreement and
19
certain upfront television commitments, many of our marketing commitments are short term in nature and we may choose to increase or
decrease our marketing expenditures in future periods depending on a number of factors including the effectiveness of our marketing activities,
changes in the number of pay subscribers, and the impact of such activities on our results of operations. Any future decreases in our marketing
expenditures would likely impact our ability to increase our pay subscriber base. While we intend to increase our marketing expenditures, there
is no assurance that we will continue to do so or that increased marketing expenditures will be successful in growing or maintaining our pay
subscriber base.
Product Development