Cigna 2015 Annual Report Download - page 81
Download and view the complete annual report
Please find page 81 of the 2015 Cigna annual report below. You can navigate through the pages in the report by either clicking on the pages listed below, or by using the keyword search tool below to find specific information within the annual report.-
 1
1 -
2
-
3
-
4
-
5
-
6
-
7
-
8
-
9
-
10
-
11
-
12
-
13
-
14
-
15
-
16
-
17
-
18
-
19
-
20
-
21
-
22
-
23
-
24
-
25
-
26
-
27
-
28
-
29
-
30
-
31
-
32
-
33
-
34
-
35
-
36
-
37
-
38
-
39
-
40
-
41
-
42
-
43
-
44
-
45
-
46
-
47
-
48
-
49
-
50
-
51
-
52
-
53
-
54
-
55
-
56
-
57
-
58
-
59
-
60
-
61
-
62
-
63
-
64
-
65
-
66
-
67
-
68
-
69
-
70
-
 71
71 -
 72
72 -
 73
73 -
 74
74 -
 75
75 -
 76
76 -
 77
77 -
 78
78 -
 79
79 -
 80
80 -
 81
81 -
 82
82 -
 83
83 -
 84
84 -
 85
85 -
 86
86 -
 87
87 -
 88
88 -
 89
89 -
 90
90 -
 91
91 -
92
-
93
-
94
-
95
-
96
-
97
-
98
-
99
-
100
-
101
-
102
-
103
-
104
-
105
-
106
-
107
-
108
-
109
-
110
-
111
-
112
-
113
-
114
-
115
-
116
-
117
-
118
-
119
-
120
-
121
-
122
-
123
-
124
-
125
-
126
-
127
-
128
-
129
-
130
-
131
-
132
-
133
-
134
-
135
-
136
-
137
-
138
-
139
-
140
-
141
-
142
-
143
-
144
-
145
-
146
-
147
-
148
-
149
-
150
-
151
-
152
-
153
-
154
-
155
-
156
-
157
-
158
-
159
-
160
-
161
-
162
-
163
-
164
-
165
-
166
-
167
-
168
-
169
-
170
-
171
-
172
-
173
-
174
-
175
-
176
-
177
-
178
-
179
-
180
 |
 |

PART II
ITEM 7. Management’s Discussion and Analysis of Financial Condition and Results of Operations
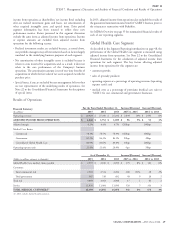
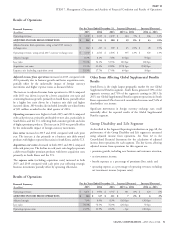
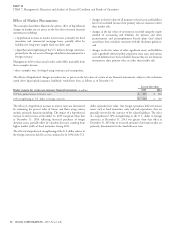
Results of Operations
For the Years Ended December 31, Increase/(Decrease) Increase/(Decrease)
Financial Summary
(In millions)
2015 2014 2013 2015 vs. 2014 2014 vs. 2013
Operating revenues $ 3,149 $ 3,005 $ 2,639 $ 144 5% $ 366 14%
ADJUSTED INCOME FROM OPERATIONS $ 262 $ 243 $ 200 $ 19 8% $ 43 22%
Adjusted income from operations, using actual 2015 currency
exchange rates $ 262 $ 217 $ 189 $ 45 21% $ 28 15%
Operating revenues, using actual 2015 currency exchange rates $ 3,149 $ 2,814 $ 2,494 $ 335 12% $ 320 13%
Adjusted margin 8.3% 8.1% 7.6% 20 bps 50 bps
Loss ratio 55.3% 54.3% 52.5% 100 bps 180 bps
Acquisition cost ratio 19.3% 21.0% 22.8% (170) bps (180) bps
Expense ratio (excluding acquisition costs) 18.3% 17.7% 17.4% 60 bps 30 bps
Adjusted income from operations increased in 2015 compared with
Other Items Affecting Global Supplemental Benefits
2014 primarily due to business growth and lower acquisition costs,
Results
partially offset by the unfavorable impact of foreign currency
South Korea is the single largest geographic market for our Global
movements and higher expense ratios as discussed below.
Supplemental Benefits segment. South Korea generated 50% of the
The increase in adjusted income from operations in 2014 compared segment’s revenues and 75% of the segment’s earnings in 2015. In
with 2013 was driven in part by a lower acquisition cost ratio and 2015, our Global Supplemental Benefits segment operations in South
continuing business growth, primarily in South Korea, partially offset Korea represented 4% of our total consolidated revenues and 9.6% of
by a higher loss ratio driven by a business mix shift and higher shareholders’ net income.
incurred claims. 2014 results also included favorable tax-related items
Significant movements in foreign currency exchange rates could
of $21 million recorded in the third quarter of 2014.
materially affect the reported results of the Global Supplemental
Operating revenues were higher in both 2015 and 2014 compared Benefits segment.
with each prior year, primarily attributable to new sales, particularly in
South Korea and the U.S. reflecting both customer growth and sales
Group Disability and Life Segment
of higher premium products. The increase in 2015 was partially offset
by the unfavorable impact of foreign currency movements. As described in the Segment Reporting introduction on page 48, the
performance of the Group Disability and Life segment is measured
Loss ratios increased in 2015 and 2014 compared with each prior
using adjusted income from operations. See Note 22 to the
year. The increase is due primarily to a business mix shift toward
Consolidated Financial Statements for the calculation of adjusted
products with higher expected loss ratios in South Korea and the U.S.
income from operations for each segment. The key factors affecting
Acquisition cost ratios decreased in both 2015 and 2014 compared adjusted income from operations for this segment are:
with each prior year. The decline in each year’s ratio largely represents
premium growth, including new business and customer retention;
a shift toward higher premium products with lower acquisition costs
primarily in South Korea and the U.S. net investment income;
The expense ratio (excluding acquisition costs) increased in both benefit expenses as a percentage of premiums (loss ratio); and
2015 and 2014 compared with each prior year reflecting strategic
operating expense as a percentage of operating revenues excluding
business investments partially offset by operating efficiencies.
net investment income (expense ratio).
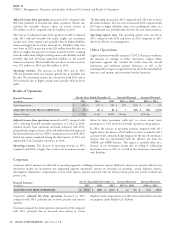
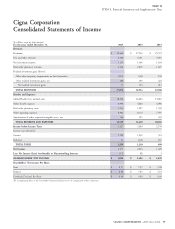
Results of Operations
For the Years Ended December 31, Increase/(Decrease) Increase/(Decrease)
Financial Summary
(In millions)
2015 2014 2013 2015 vs. 2014 2014 vs. 2013
Operating revenues $ 4,271 $ 3,970 $ 3,747 $ 301 8% $ 223 6%
ADJUSTED INCOME FROM OPERATIONS $ 324 $ 317 $ 311 $ 7 2% $ 6 2%
Adjusted margin 7.6% 8.0% 8.3% (40) bps (30) bps
Loss ratio 76.3% 76.5% 76.0% (20) bps 50 bps
Operating expense ratio 21.9% 21.9% 22.2% – bps (30) bps
CIGNA CORPORATION - 2015 Form 10-K 51
•
•
•
•