Cigna 2015 Annual Report Download - page 80
Download and view the complete annual report
Please find page 80 of the 2015 Cigna annual report below. You can navigate through the pages in the report by either clicking on the pages listed below, or by using the keyword search tool below to find specific information within the annual report.-
 1
1 -
2
-
3
-
4
-
5
-
6
-
7
-
8
-
9
-
10
-
11
-
12
-
13
-
14
-
15
-
16
-
17
-
18
-
19
-
20
-
21
-
22
-
23
-
24
-
25
-
26
-
27
-
28
-
29
-
30
-
31
-
32
-
33
-
34
-
35
-
36
-
37
-
38
-
39
-
40
-
41
-
42
-
43
-
44
-
45
-
46
-
47
-
48
-
49
-
50
-
51
-
52
-
53
-
54
-
55
-
56
-
57
-
58
-
59
-
60
-
61
-
62
-
63
-
64
-
65
-
66
-
67
-
68
-
69
-
 70
70 -
 71
71 -
 72
72 -
 73
73 -
 74
74 -
 75
75 -
 76
76 -
 77
77 -
 78
78 -
 79
79 -
 80
80 -
 81
81 -
 82
82 -
 83
83 -
 84
84 -
 85
85 -
 86
86 -
 87
87 -
 88
88 -
 89
89 -
 90
90 -
91
-
92
-
93
-
94
-
95
-
96
-
97
-
98
-
99
-
100
-
101
-
102
-
103
-
104
-
105
-
106
-
107
-
108
-
109
-
110
-
111
-
112
-
113
-
114
-
115
-
116
-
117
-
118
-
119
-
120
-
121
-
122
-
123
-
124
-
125
-
126
-
127
-
128
-
129
-
130
-
131
-
132
-
133
-
134
-
135
-
136
-
137
-
138
-
139
-
140
-
141
-
142
-
143
-
144
-
145
-
146
-
147
-
148
-
149
-
150
-
151
-
152
-
153
-
154
-
155
-
156
-
157
-
158
-
159
-
160
-
161
-
162
-
163
-
164
-
165
-
166
-
167
-
168
-
169
-
170
-
171
-
172
-
173
-
174
-
175
-
176
-
177
-
178
-
179
-
180
 |
 |
PART II
ITEM 7. Management’s Discussion and Analysis of Financial Condition and Results of Operations
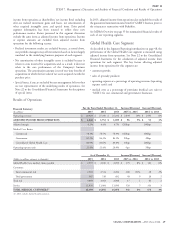
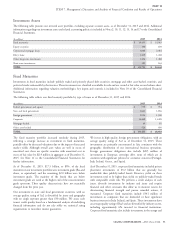
Adjusted income from operations increased in 2015 compared with and Medicaid business. These increases were partially offset by lower
2014, reflecting U.S. Commercial business growth, including revenue due to our exit from the limited benefits business.
increased contributions from pharmacy, stop loss and other specialty Medical care ratios. The Commercial medical care ratio decreased
products. Results in 2015 also reflect the impact of increased slightly in 2015 compared with 2014 primarily due to improved
investments in business initiatives. performance in our stop loss business. In 2014, the commercial
Adjusted income from operations increased in 2014 compared with medical care ratio decreased slightly compared with 2013 due to rate
2013. This growth was primarily driven by increased specialty increases to cover new taxes and fees mandated by Health Care
contributions, partially offset by lower earnings in our government Reform and improved performance in our specialty business, partially
segment. In addition, results included the impact of higher operating offset by a higher medical care ratio in the U.S. Individual business
expenses and lower margins in our U.S. commercial group risk and our exit from the limited benefits business.
business. The Government medical care ratio increased in 2015 compared with
Operating revenues. The increase in operating revenues in 2015, 2014 due to an increase in Medicare Part D utilization. In 2014, the
compared with 2014 is primarily due to a higher customer base in our Government medical care ratio increased slightly compared with 2013
government segment, as well as revenue growth in specialty businesses due to higher Medicare Part D pharmacy costs offset by improved
and higher premiums in the U.S. commercial segment reflecting rate per-member revenues in the Medicare Advantage business.
actions on most risk products primarily to recover underlying medical Operating expense ratio. The operating expense ratio was flat in
cost trends. 2015 compared with 2014, reflecting business-initiative investments
The increase in 2014 compared with 2013 was primarily driven by offset by higher revenue and disciplined expense management. The
growth in specialty businesses, higher premiums in the U.S. operating expense ratio increased in 2014 compared with 2013
commercial segment reflecting rate actions on most risk products to primarily due to the impact of Health Care Reform taxes and fees that
recover underlying medical cost trends and taxes and fees mandated became effective in 2014.
by Health Care Reform, and a higher customer base in our individual
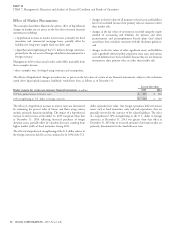
Other Items Affecting Health Care Results
Global Health Care Medical Costs Payable
Medical costs payable is higher as of December 31, 2015 compared with 2014, primarily due to growth in the stop loss book of business and the
Government segment. See Note 5 to the Consolidated Financial Statements for additional information. Medical costs payable increased in 2014
compared with 2013, primarily driven by growth in the individual and stop loss books of business.
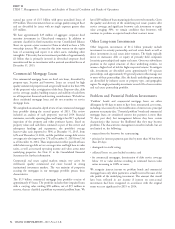
Medical Customers
A medical customer is defined as a person meeting any one of the following criteria:
is covered under an insurance policy or service agreement issued by us;
has access to the Company’s provider network for covered services under their medical plan; or
has medical claims that are administered by us.
Our medical customer base as of December 31, 2015 was higher than 2014, driven by strong overall retention and sales in our targeted market
segments, as well as the acquisition of QualCare Alliance Networks, Inc. on February 28, 2015.
As required by Health Care Reform, we exited the limited benefits business effective December 31, 2013. Excluding this impact, our medical
customer base increased in 2014 compared with 2013, primarily driven by continued growth in our targeted market segments.
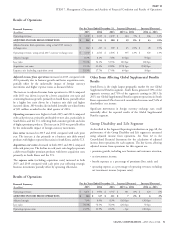
Global Supplemental Benefits Segment
As described in the Segment Reporting introduction on page 48, the performance of the Global Supplemental Benefits segment is measured using
adjusted income from operations. See Note 22 to the Consolidated Financial Statements for the calculation of adjusted income from operations
for each segment. The key factors affecting adjusted income from operations for this segment are:
premium growth, including new business and customer retention;
benefit expenses as a percentage of premiums (loss ratio);
operating expense and acquisition expense as a percentage of operating revenues (expense ratio and acquisition cost ratio); and
the impact of foreign currency movements.
Throughout this discussion and the table presented below, prior period currency adjusted income from operations and operating revenues are
calculated by applying the current period’s exchange rates to reported results in the prior period. A strengthening U.S. Dollar against foreign
currencies will decrease segment earnings, while a weakening U.S. Dollar produces the opposite effect.
50 CIGNA CORPORATION - 2015 Form 10-K
•
•
•
•
•
•
•