Cigna 2015 Annual Report Download - page 113
Download and view the complete annual report
Please find page 113 of the 2015 Cigna annual report below. You can navigate through the pages in the report by either clicking on the pages listed below, or by using the keyword search tool below to find specific information within the annual report.-
 1
1 -
2
-
3
-
4
-
5
-
6
-
7
-
8
-
9
-
10
-
11
-
12
-
13
-
14
-
15
-
16
-
17
-
18
-
19
-
20
-
21
-
22
-
23
-
24
-
25
-
26
-
27
-
28
-
29
-
30
-
31
-
32
-
33
-
34
-
35
-
36
-
37
-
38
-
39
-
40
-
41
-
42
-
43
-
44
-
45
-
46
-
47
-
48
-
49
-
50
-
51
-
52
-
53
-
54
-
55
-
56
-
57
-
58
-
59
-
60
-
61
-
62
-
63
-
64
-
65
-
66
-
67
-
68
-
69
-
70
-
71
-
72
-
73
-
74
-
75
-
76
-
77
-
78
-
79
-
80
-
81
-
82
-
83
-
84
-
85
-
86
-
87
-
88
-
89
-
90
-
91
-
92
-
93
-
94
-
95
-
96
-
97
-
98
-
99
-
100
-
101
-
102
-
 103
103 -
 104
104 -
 105
105 -
 106
106 -
 107
107 -
 108
108 -
 109
109 -
 110
110 -
 111
111 -
 112
112 -
 113
113 -
 114
114 -
 115
115 -
 116
116 -
 117
117 -
 118
118 -
 119
119 -
 120
120 -
 121
121 -
 122
122 -
 123
123 -
124
-
125
-
126
-
127
-
128
-
129
-
130
-
131
-
132
-
133
-
134
-
135
-
136
-
137
-
138
-
139
-
140
-
141
-
142
-
143
-
144
-
145
-
146
-
147
-
148
-
149
-
150
-
151
-
152
-
153
-
154
-
155
-
156
-
157
-
158
-
159
-
160
-
161
-
162
-
163
-
164
-
165
-
166
-
167
-
168
-
169
-
170
-
171
-
172
-
173
-
174
-
175
-
176
-
177
-
178
-
179
-
180
 |
 |

PART II
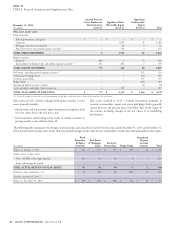
ITEM 8. Financial Statements and Supplementary Data
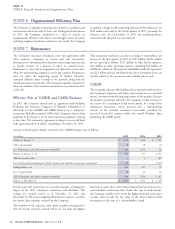
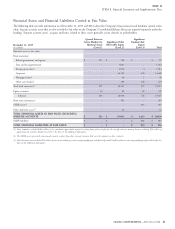
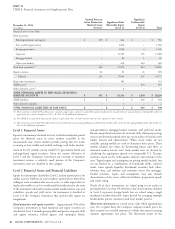
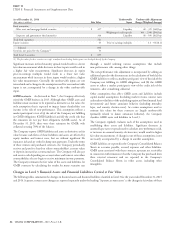
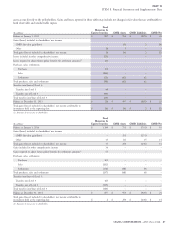
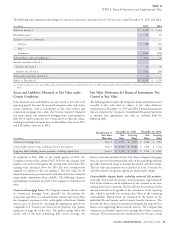
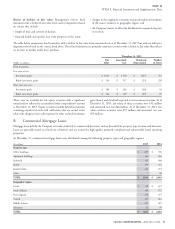
Financial Assets and Financial Liabilities Carried at Fair Value
The following tables provide information as of December 31, 2015 and 2014 about the Company’s financial assets and liabilities carried at fair
value. Separate account assets that are also recorded at fair value on the Company’s Consolidated Balance Sheets are reported separately under the
heading ‘‘Separate account assets’’ as gains and losses related to these assets generally accrue directly to policyholders.
Quoted Prices in Significant
Active Markets for Significant Other Unobservable
Identical Assets Observable Inputs Inputs
December 31, 2015
(In millions)
(Level 1) (Level 2) (Level 3) Total
Financial assets at fair value:
Fixed maturities:
Federal government and agency $ 251 $ 528 $ – $ 779
State and local government – 1,641 – 1,641
Foreign government – 2,010 4 2,014
Corporate – 14,122 326 14,448
Mortgage-backed – 48 1 49
Other asset-backed – 198 326 524
Total fixed maturities
(1)
251 18,547 657 19,455
Equity securities 32 89 69 190
Subtotal 283 18,636 726 19,645
Short-term investments – 381 – 381
GMIB assets
(2)
– – 907 907
Other derivative assets
(3)
–16–16
TOTAL FINANCIAL ASSETS AT FAIR VALUE, EXCLUDING
SEPARATE ACCOUNTS $ 283 $ 19,033 $ 1,633 $ 20,949
GMIB liabilities $ – $ – $ 885 $ 885
TOTAL FINANCIAL LIABILITIES AT FAIR VALUE $ – $ – $ 885 $ 885
(1) Fixed maturities included $483 million of net cumulative appreciation required to adjust future policy benefits for the run-off settlement annuity business including $30 million of
appreciation for securities classified in Level 3. See Note 11 for additional information.
(2) The GMIB assets represented retrocessional contracts in place from three external reinsurers that cover the exposures on these contracts.
(3) Other derivative assets included $15 million of interest rate and foreign currency swaps qualifying as cash flow hedges and $1 million of interest rate swaps qualifying as fair value hedges. See
Note 12 for additional information.
CIGNA CORPORATION - 2015 Form 10-K 83