Cigna 2015 Annual Report Download - page 126
Download and view the complete annual report
Please find page 126 of the 2015 Cigna annual report below. You can navigate through the pages in the report by either clicking on the pages listed below, or by using the keyword search tool below to find specific information within the annual report.-
 1
1 -
2
-
3
-
4
-
5
-
6
-
7
-
8
-
9
-
10
-
11
-
12
-
13
-
14
-
15
-
16
-
17
-
18
-
19
-
20
-
21
-
22
-
23
-
24
-
25
-
26
-
27
-
28
-
29
-
30
-
31
-
32
-
33
-
34
-
35
-
36
-
37
-
38
-
39
-
40
-
41
-
42
-
43
-
44
-
45
-
46
-
47
-
48
-
49
-
50
-
51
-
52
-
53
-
54
-
55
-
56
-
57
-
58
-
59
-
60
-
61
-
62
-
63
-
64
-
65
-
66
-
67
-
68
-
69
-
70
-
71
-
72
-
73
-
74
-
75
-
76
-
77
-
78
-
79
-
80
-
81
-
82
-
83
-
84
-
85
-
86
-
87
-
88
-
89
-
90
-
91
-
92
-
93
-
94
-
95
-
96
-
97
-
98
-
99
-
100
-
101
-
102
-
103
-
104
-
105
-
106
-
107
-
108
-
109
-
110
-
111
-
112
-
113
-
114
-
115
-
 116
116 -
 117
117 -
 118
118 -
 119
119 -
 120
120 -
 121
121 -
 122
122 -
 123
123 -
 124
124 -
 125
125 -
 126
126 -
 127
127 -
 128
128 -
 129
129 -
 130
130 -
 131
131 -
 132
132 -
 133
133 -
 134
134 -
 135
135 -
 136
136 -
137
-
138
-
139
-
140
-
141
-
142
-
143
-
144
-
145
-
146
-
147
-
148
-
149
-
150
-
151
-
152
-
153
-
154
-
155
-
156
-
157
-
158
-
159
-
160
-
161
-
162
-
163
-
164
-
165
-
166
-
167
-
168
-
169
-
170
-
171
-
172
-
173
-
174
-
175
-
176
-
177
-
178
-
179
-
180
 |
 |

PART II
ITEM 8. Financial Statements and Supplementary Data
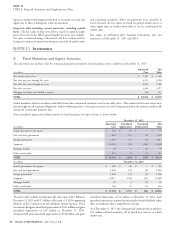
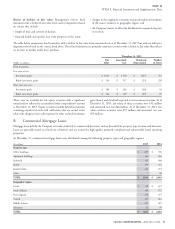
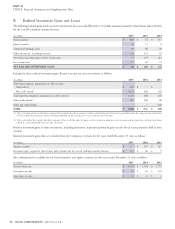
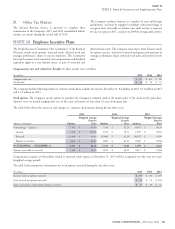
B. Realized Investment Gains and Losses
The following realized gains and losses on investments for the years ended December 31 exclude amounts required to adjust future policy benefits
for the run-off settlement annuity business.
(In millions)
2015 2014 2013
Fixed maturities $ (82) $ 14 $ 113
Equity securities 36 13 8
Commercial mortgage loans (2) (6) (3)
Other investments, including derivatives 105 133 95
Net realized investment gains, before income taxes 57 154 213
Less income taxes 17 48 72
NET REALIZED INVESTMENT GAINS $ 40 $ 106 $ 141
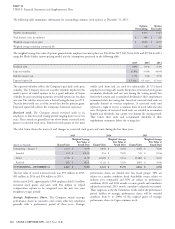
Included in these realized investment gains (losses) were pre-tax asset write-downs as follows:
(In millions)
2015 2014 2013
Other-than-temporary impairments on debt securities:
Credit-related $ (11) $ – $ –
Non credit-related
(1)
(101) (36) (11)
Total other-than-temporary impairments on debt securities (112) (36) (11)
Other credit-related
(2)
(28) (16) (8)
Other non credit-related – – (10)
TOTAL $ (140) $ (52) $ (29)
(1) These write-downs pertain to other-than-temporary declines in fair values due to increases in market yields (widening of credit spreads), particularly within the energy sector, for certain below
investment grade fixed maturities with an increased probability of sales activity prior to recovery of amortized cost basis.
(2) Other credit-related losses include other-than-temporary declines in the fair values of equity securities, increases in valuation reserves on commercial mortgage loans, and asset write-downs
related to security partnerships and real estate investments.
Realized investment gains in other investments, including derivatives, represented primarily gains on sale of real estate properties held in joint
ventures.
Realized investment gains that are excluded from the Company’s revenues for the years ended December 31 were as follows:
(In millions)
2015 2014 2013
Separate accounts $ 117 $ 376 $ 417
Investment gains required to adjust future policy benefits for the run-off settlement annuity business $ 114 $ 86 $ 9
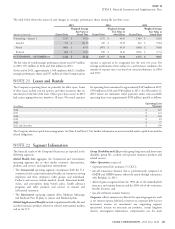
Sales information for available-for-sale fixed maturities and equity securities for the years ended December 31 were as follows:
(In millions)
2015 2014 2013
Proceeds from sales $ 1,555 $ 1,769 $ 1,775
Gross gains on sales $ 85 $ 62 $ 102
Gross losses on sales $13$ 6$ 4
96 CIGNA CORPORATION - 2015 Form 10-K