Cigna 2015 Annual Report Download - page 72
Download and view the complete annual report
Please find page 72 of the 2015 Cigna annual report below. You can navigate through the pages in the report by either clicking on the pages listed below, or by using the keyword search tool below to find specific information within the annual report.-
 1
1 -
2
-
3
-
4
-
5
-
6
-
7
-
8
-
9
-
10
-
11
-
12
-
13
-
14
-
15
-
16
-
17
-
18
-
19
-
20
-
21
-
22
-
23
-
24
-
25
-
26
-
27
-
28
-
29
-
30
-
31
-
32
-
33
-
34
-
35
-
36
-
37
-
38
-
39
-
40
-
41
-
42
-
43
-
44
-
45
-
46
-
47
-
48
-
49
-
50
-
51
-
52
-
53
-
54
-
55
-
56
-
57
-
58
-
59
-
60
-
61
-
 62
62 -
 63
63 -
 64
64 -
 65
65 -
 66
66 -
 67
67 -
 68
68 -
 69
69 -
 70
70 -
 71
71 -
 72
72 -
 73
73 -
 74
74 -
 75
75 -
 76
76 -
 77
77 -
 78
78 -
 79
79 -
 80
80 -
 81
81 -
 82
82 -
83
-
84
-
85
-
86
-
87
-
88
-
89
-
90
-
91
-
92
-
93
-
94
-
95
-
96
-
97
-
98
-
99
-
100
-
101
-
102
-
103
-
104
-
105
-
106
-
107
-
108
-
109
-
110
-
111
-
112
-
113
-
114
-
115
-
116
-
117
-
118
-
119
-
120
-
121
-
122
-
123
-
124
-
125
-
126
-
127
-
128
-
129
-
130
-
131
-
132
-
133
-
134
-
135
-
136
-
137
-
138
-
139
-
140
-
141
-
142
-
143
-
144
-
145
-
146
-
147
-
148
-
149
-
150
-
151
-
152
-
153
-
154
-
155
-
156
-
157
-
158
-
159
-
160
-
161
-
162
-
163
-
164
-
165
-
166
-
167
-
168
-
169
-
170
-
171
-
172
-
173
-
174
-
175
-
176
-
177
-
178
-
179
-
180
 |
 |

PART II
ITEM 7. Management’s Discussion and Analysis of Financial Condition and Results of Operations
Consolidated short-term investments increased in 2015 compared with 2014 as a result of higher net purchases of short-term investments at the
parent company level. The decrease in short-term investments in 2014 compared with 2013 resulted from the Company’s investment mix shift
toward longer-term holdings.
Liquidity
We maintain liquidity at two levels: the subsidiary level and the parent company level.
Liquidity requirements at the subsidiary level generally consist of:
• medical costs and benefit payments to policyholders; and
• operating expense requirements, primarily for employee compensation and benefits.
Our subsidiaries normally meet their operating requirements by:
• maintaining appropriate levels of cash, cash equivalents and short-term investments;
• using cash flows from operating activities;
• selling investments;
• matching investment durations to those estimated for the related insurance and contractholder liabilities; and
• borrowing from affiliates, subject to applicable regulatory limits.
Liquidity requirements at the parent company level generally consist of:
• debt service and dividend payments to shareholders;
• pension plan funding; and
• repurchases of common stock.
The parent company normally meets its liquidity requirements by:
• maintaining appropriate levels of cash and various types of marketable investments;
• collecting dividends from its subsidiaries;
• using proceeds from issuance of debt and equity securities; and
• borrowing from its subsidiaries.
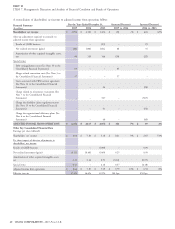
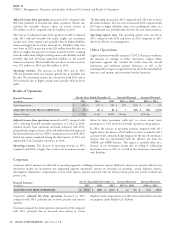
Cash flows for the years ended December 31, were as follows:
(In millions)
2015 2014 2013
Net cash provided by operating activities $ 2,717 $ 1,994 $ 719
Net cash provided by (used in) investing activities $ (1,599) $ (1,755) $ 15
Net cash used in financing activities $ (530) $ (1,582) $ (930)
Cash flows from operating activities consist of cash receipts and
Operating activities
disbursements for premiums and fees, mail order pharmacy, other Cash flows from operating activities increased in 2015 compared with
revenues, investment income, taxes, benefits and expenses. Because 2014 primarily driven by the volume and timing of government
certain income and expense transactions do not generate cash, and reimbursements and pharmacy considerations.
because cash transactions related to revenues and expenses may occur
in periods different from when those revenues and expenses are Cash flows from operating activities increased substantially in 2014
recognized in shareholders’ net income, cash flows from operating compared with 2013, primarily due to the absence of the 2013
activities can be significantly different from shareholders’ net income. reinsurance payments totaling $2.2 billion to Berkshire. Excluding
those payments and tax benefits realized in connection with the
Cash flows from investing activities generally consist of net Berkshire transaction, cash flows from operating activities in 2014
investment purchases or sales and net purchases of property and decreased by $0.6 billion, compared with 2013. This decrease was
equipment including capitalized software, as well as cash used to primarily related to the volume and timing of reimbursements
acquire businesses. prescribed by government programs.
Cash flows from financing activities are generally comprised of
issuances and re-payment of debt at the parent company level,
Investing activities
proceeds on the issuance of common stock resulting from stock
Net cash used in investing activities decreased in 2015 compared with
option exercises, and stock repurchases. In addition, the subsidiaries
2014, due to lower net purchases of fixed maturities. Cash flows from
report deposits to and withdrawals from investment contract liabilities
investing activities decreased by $1.8 billion in 2014 compared with
(including universal life insurance liabilities) because such liabilities
2013, primarily due to higher net purchases of fixed maturities. In
are considered financing activities with policyholders.
2013, net purchases of fixed maturities were lower than 2014
primarily due to funding the Berkshire transaction.
42 CIGNA CORPORATION - 2015 Form 10-K