Cigna 2015 Annual Report Download - page 120
Download and view the complete annual report
Please find page 120 of the 2015 Cigna annual report below. You can navigate through the pages in the report by either clicking on the pages listed below, or by using the keyword search tool below to find specific information within the annual report.-
 1
1 -
2
-
3
-
4
-
5
-
6
-
7
-
8
-
9
-
10
-
11
-
12
-
13
-
14
-
15
-
16
-
17
-
18
-
19
-
20
-
21
-
22
-
23
-
24
-
25
-
26
-
27
-
28
-
29
-
30
-
31
-
32
-
33
-
34
-
35
-
36
-
37
-
38
-
39
-
40
-
41
-
42
-
43
-
44
-
45
-
46
-
47
-
48
-
49
-
50
-
51
-
52
-
53
-
54
-
55
-
56
-
57
-
58
-
59
-
60
-
61
-
62
-
63
-
64
-
65
-
66
-
67
-
68
-
69
-
70
-
71
-
72
-
73
-
74
-
75
-
76
-
77
-
78
-
79
-
80
-
81
-
82
-
83
-
84
-
85
-
86
-
87
-
88
-
89
-
90
-
91
-
92
-
93
-
94
-
95
-
96
-
97
-
98
-
99
-
100
-
101
-
102
-
103
-
104
-
105
-
106
-
107
-
108
-
109
-
 110
110 -
 111
111 -
 112
112 -
 113
113 -
 114
114 -
 115
115 -
 116
116 -
 117
117 -
 118
118 -
 119
119 -
 120
120 -
 121
121 -
 122
122 -
 123
123 -
 124
124 -
 125
125 -
 126
126 -
 127
127 -
 128
128 -
 129
129 -
 130
130 -
131
-
132
-
133
-
134
-
135
-
136
-
137
-
138
-
139
-
140
-
141
-
142
-
143
-
144
-
145
-
146
-
147
-
148
-
149
-
150
-
151
-
152
-
153
-
154
-
155
-
156
-
157
-
158
-
159
-
160
-
161
-
162
-
163
-
164
-
165
-
166
-
167
-
168
-
169
-
170
-
171
-
172
-
173
-
174
-
175
-
176
-
177
-
178
-
179
-
180
 |
 |
PART II
ITEM 8. Financial Statements and Supplementary Data
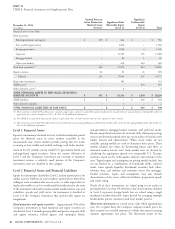
inputs are unobservable (supported by little or no market activity) and and remaining maturities. These measurements were classified in
significant to their resulting fair value measurement. Level 2 because the fair values are based on quoted market prices or
other inputs that are market observable or can be corroborated by
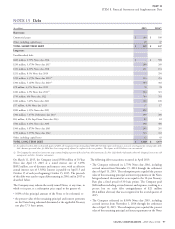
Long-term debt, including current maturities, excluding capital market data.
leases. The fair value of long-term debt is based on quoted market
prices for recent trades. When quoted market prices are not available, Fair values of off-balance-sheet financial instruments were not
fair value is estimated using a discounted cash flow analysis and the material as of December 31, 2015 and 2014.
Company’s estimated current borrowing rate for debt of similar terms
Investments
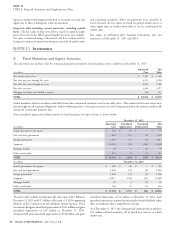
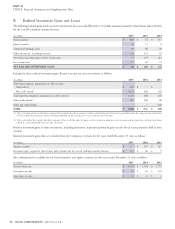
A. Fixed Maturities and Equity Securities
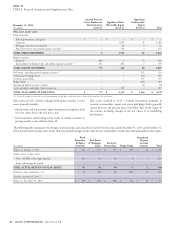
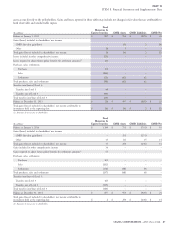
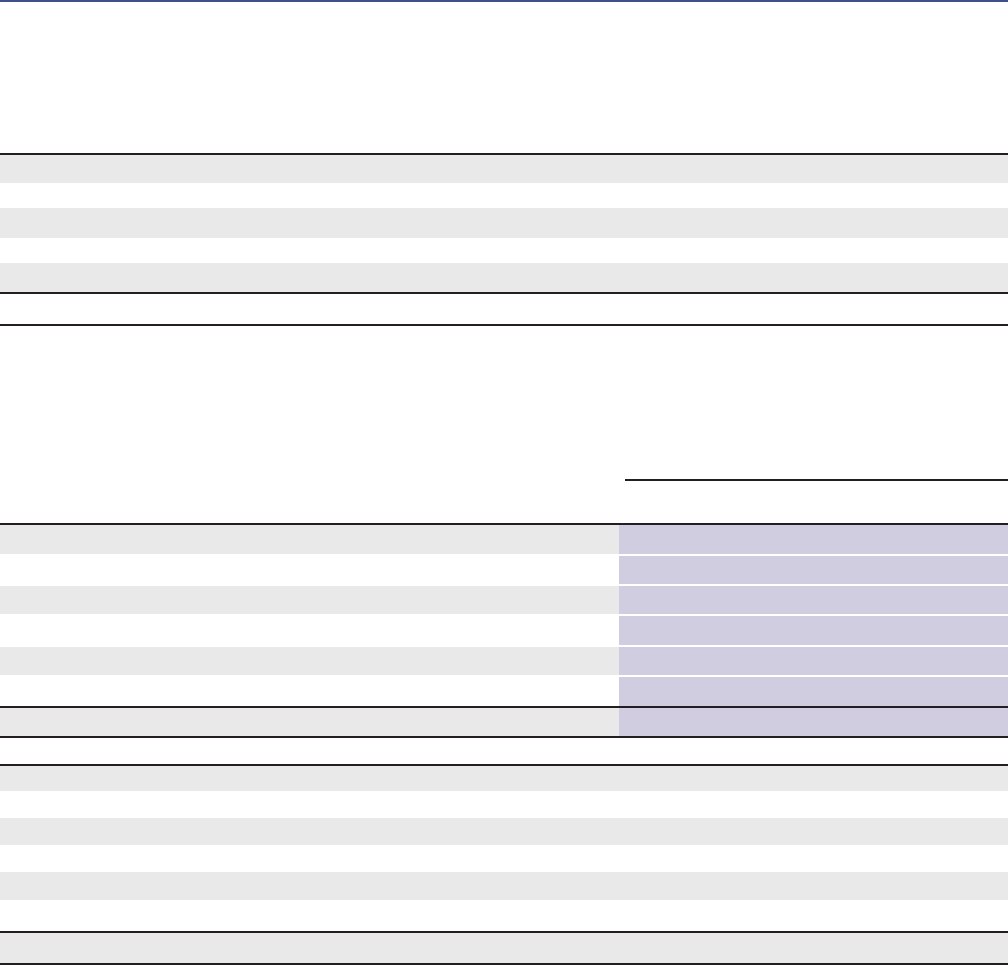
The amortized cost and fair value by contractual maturity periods for fixed maturities were as follows at December 31, 2015:
Amortized Fair
(In millions)
Cost Value
Due in one year or less $ 1,397 $ 1,403
Due after one year through five years 6,251 6,504
Due after five years through ten years 6,905 7,058
Due after ten years 3,363 3,917
Mortgage and other asset-backed securities 540 573
TOTAL $ 18,456 $ 19,455
Actual maturities of these securities could differ from their contractual maturities used in the table above. This could occur because issuers may
have the right to call or prepay obligations, with or without penalties, or because in certain cases the Company may have the option to unilaterally
extend the contractual maturity date.
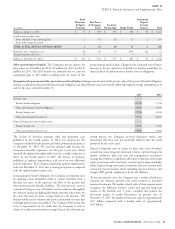
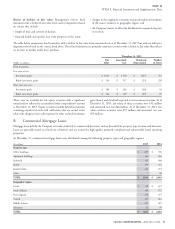
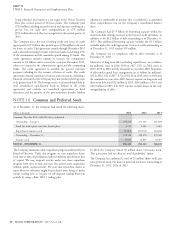
Gross unrealized appreciation (depreciation) on fixed maturities by type of issuer is shown below.
December 31, 2015
Amortized Unrealized Unrealized Fair
(In millions)
Cost Appreciation Depreciation Value
Federal government and agency $ 528 $ 251 $ – $ 779
State and local government 1,496 147 (2) 1,641
Foreign government 1,870 147 (3) 2,014
Corporate 14,022 632 (206) 14,448
Mortgage-backed 48 2 (1) 49
Other asset-backed 492 39 (7) 524
TOTAL $ 18,456 $ 1,218 $ (219) $ 19,455
(In millions)
December 31, 2014
Federal government and agency $ 608 $ 346 $ – $ 954
State and local government 1,682 176 (2) 1,856
Foreign government 1,824 121 (5) 1,940
Corporate 12,517 1,014 (33) 13,498
Mortgage-backed 83 3 (1) 85
Other asset-backed 564 87 (1) 650
TOTAL $ 17,278 $ 1,747 $ (42) $ 18,983
The above table includes investments with a fair value of $2.7 billion at unrealized depreciation of $2 million at December 31, 2014. Such
unrealized amounts are reported in future policy benefit liabilities rather
December 31, 2015 and $3.1 billion at December 31, 2014 supporting
than accumulated other comprehensive income.
liabilities of the Company’s run-off settlement annuity business. These
investments had gross unrealized appreciation of $521 million and gross As of December 31, 2015, the Company had commitments to purchase
unrealized depreciation of $38 million at December 31, 2015, $15 million of fixed maturities, all of which bear interest at a fixed
compared with gross unrealized appreciation of $758 million and gross market rate.
90 CIGNA CORPORATION - 2015 Form 10-K
NOTE 11