Cigna 2015 Annual Report Download - page 64
Download and view the complete annual report
Please find page 64 of the 2015 Cigna annual report below. You can navigate through the pages in the report by either clicking on the pages listed below, or by using the keyword search tool below to find specific information within the annual report.-
 1
1 -
2
-
3
-
4
-
5
-
6
-
7
-
8
-
9
-
10
-
11
-
12
-
13
-
14
-
15
-
16
-
17
-
18
-
19
-
20
-
21
-
22
-
23
-
24
-
25
-
26
-
27
-
28
-
29
-
30
-
31
-
32
-
33
-
34
-
35
-
36
-
37
-
38
-
39
-
40
-
41
-
42
-
43
-
44
-
45
-
46
-
47
-
48
-
49
-
50
-
51
-
52
-
53
-
 54
54 -
 55
55 -
 56
56 -
 57
57 -
 58
58 -
 59
59 -
 60
60 -
 61
61 -
 62
62 -
 63
63 -
 64
64 -
 65
65 -
 66
66 -
 67
67 -
 68
68 -
 69
69 -
 70
70 -
 71
71 -
 72
72 -
 73
73 -
 74
74 -
75
-
76
-
77
-
78
-
79
-
80
-
81
-
82
-
83
-
84
-
85
-
86
-
87
-
88
-
89
-
90
-
91
-
92
-
93
-
94
-
95
-
96
-
97
-
98
-
99
-
100
-
101
-
102
-
103
-
104
-
105
-
106
-
107
-
108
-
109
-
110
-
111
-
112
-
113
-
114
-
115
-
116
-
117
-
118
-
119
-
120
-
121
-
122
-
123
-
124
-
125
-
126
-
127
-
128
-
129
-
130
-
131
-
132
-
133
-
134
-
135
-
136
-
137
-
138
-
139
-
140
-
141
-
142
-
143
-
144
-
145
-
146
-
147
-
148
-
149
-
150
-
151
-
152
-
153
-
154
-
155
-
156
-
157
-
158
-
159
-
160
-
161
-
162
-
163
-
164
-
165
-
166
-
167
-
168
-
169
-
170
-
171
-
172
-
173
-
174
-
175
-
176
-
177
-
178
-
179
-
180
 |
 |
PART II
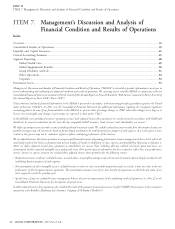
ITEM 7. Management’s Discussion and Analysis of Financial Condition and Results of Operations
Management’s Discussion and Analysis of
Financial Condition and Results of Operations
Index
.......................................................................................................................................................................................
35
..............................................................................................................................................
39
....................................................................................................................................................
41
.......................................................................................................................................................
45
.......................................................................................................................................................................
48
...............................................................................................................................................................
49
................................................................................................................................................
50
.....................................................................................................................................................
51
..................................................................................................................................................................
52
..............................................................................................................................................................................
52
..........................................................................................................................................................................
53
Management’s Discussion and Analysis of Financial Condition and Results of Operations (‘‘MD&A’’) is intended to provide information to assist you in
better understanding and evaluating our financial condition and results of operations. We encourage you to read this MD&A in conjunction with our
Consolidated Financial Statements included in Part II, Item 8 of this Annual Report on Form 10-K and the ‘‘Risk Factors’’ contained in Part I, Item 1A of
this Annual Report on Form 10-K (‘‘Form 10-K’’) .
Unless otherwise indicated, financial information in the MD&A is presented in accordance with accounting principles generally accepted in the United
States of America (‘‘GAAP’’). See Note 2 to the Consolidated Financial Statements for additional information regarding the Company’s significant
accounting policies. In some of our financial tables in this MD&A, we present either percentage changes or ‘‘N/M’’ when those changes are so large as to
become not meaningful, and changes in percentages are expressed in basis points (‘‘bps’’).
In this MD&A, our consolidated measures ‘‘operating revenues’’ and ‘‘adjusted income from operations’’ are not determined in accordance with GAAP and
should not be viewed as substitutes for the most directly comparable GAAP measures ‘‘total revenues’’ and ‘‘shareholders’ net income.’’
We define operating revenues as total revenues excluding realized investment results. We exclude realized investment results from this measure because our
portfolio managers may sell investments based on factors largely unrelated to the underlying business purposes of each segment. As a result, gains or losses
created in this process may not be indicative of past or future underlying performance of the business.
We use adjusted income (loss) from operations as our principal financial measure of operating performance because management believes it best reflects the
underlying results of our business operations and permits analysis of trends in underlying revenue, expenses and profitability. Beginning on January 1,
2015, we define adjusted income from operations as shareholders’ net income (loss) excluding after-tax realized investment gains and losses, net
amortization of other acquired intangible assets and special items. Prior period segment information has been restated to reflect these new performance
metrics. Income or expense amounts are excluded from adjusted income from operations for the following reasons:
Realized investment results are excluded because, as noted above, our portfolio managers may sell investments based on factors largely unrelated to the
underlying business purposes of each segment.
Net amortization of other intangible assets is excluded because it relates to costs incurred for acquisitions and, as a result, it does not relate to the core
performance of the Company’s business operations. The amortization amount is net of one-time benefits of acquisitions in which the fair value of net
assets acquired exceeds the purchase price.
Special items, if any, are excluded because management believes they are not representative of the underlying results of operations. See Note 22 to the
Consolidated Financial Statements for descriptions of special items.
In 2013, adjusted income from operations also excluded the results of the guaranteed minimum income benefit (‘‘GMIB’’) business prior to the reinsurance
transaction with Berkshire Hathaway Life Insurance Company of Nebraska (‘‘Berkshire’’).
34 CIGNA CORPORATION - 2015 Form 10-K
ITEM 7.
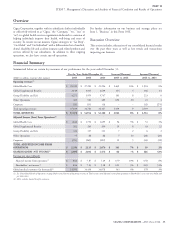
Overview
Consolidated Results of Operations
Liquidity and Capital Resources
Critical Accounting Estimates
Segment Reporting
Global Health Care
Global Supplemental Benefits
Group Disability and Life
Other Operations
Corporate
Investment Assets
•
•
•