Cigna 2015 Annual Report Download - page 134
Download and view the complete annual report
Please find page 134 of the 2015 Cigna annual report below. You can navigate through the pages in the report by either clicking on the pages listed below, or by using the keyword search tool below to find specific information within the annual report.-
 1
1 -
2
-
3
-
4
-
5
-
6
-
7
-
8
-
9
-
10
-
11
-
12
-
13
-
14
-
15
-
16
-
17
-
18
-
19
-
20
-
21
-
22
-
23
-
24
-
25
-
26
-
27
-
28
-
29
-
30
-
31
-
32
-
33
-
34
-
35
-
36
-
37
-
38
-
39
-
40
-
41
-
42
-
43
-
44
-
45
-
46
-
47
-
48
-
49
-
50
-
51
-
52
-
53
-
54
-
55
-
56
-
57
-
58
-
59
-
60
-
61
-
62
-
63
-
64
-
65
-
66
-
67
-
68
-
69
-
70
-
71
-
72
-
73
-
74
-
75
-
76
-
77
-
78
-
79
-
80
-
81
-
82
-
83
-
84
-
85
-
86
-
87
-
88
-
89
-
90
-
91
-
92
-
93
-
94
-
95
-
96
-
97
-
98
-
99
-
100
-
101
-
102
-
103
-
104
-
105
-
106
-
107
-
108
-
109
-
110
-
111
-
112
-
113
-
114
-
115
-
116
-
117
-
118
-
119
-
120
-
121
-
122
-
123
-
 124
124 -
 125
125 -
 126
126 -
 127
127 -
 128
128 -
 129
129 -
 130
130 -
 131
131 -
 132
132 -
 133
133 -
 134
134 -
 135
135 -
 136
136 -
 137
137 -
 138
138 -
 139
139 -
 140
140 -
 141
141 -
 142
142 -
 143
143 -
 144
144 -
145
-
146
-
147
-
148
-
149
-
150
-
151
-
152
-
153
-
154
-
155
-
156
-
157
-
158
-
159
-
160
-
161
-
162
-
163
-
164
-
165
-
166
-
167
-
168
-
169
-
170
-
171
-
172
-
173
-
174
-
175
-
176
-
177
-
178
-
179
-
180
 |
 |

PART II
ITEM 8. Financial Statements and Supplementary Data
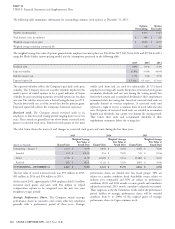
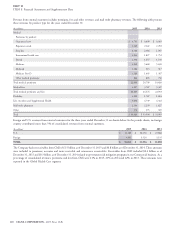
The following table summarizes information for outstanding common stock options at December 31, 2015:
Options Options
Outstanding Exercisable
Number (in thousands) 6,433 3,414
Total intrinsic value (in millions) $ 498 $ 341
Weighted average exercise price $ 68.86 $ 46.55
Weighted average remaining contractual life 6.8 5.4
The weighted average fair value of options granted under employee incentive plans was $36.40 for 2015, $23.56 for 2014 and $19.84 for 2013
using the Black-Scholes option-pricing model and the assumptions presented in the following table.
2015 2014 2013
Dividend yield 0.0% 0.1% 0.1%
Expected volatility 35.0% 35.0% 40.0%
Risk-free interest rate 1.3% 1.3% 0.7%
Expected option life 4.3 years 4.3 years 4.5 years
The expected volatility reflects the Company’s past daily stock price widely used form and are used for substantially all U.S.-based
volatility. The Company does not consider volatility implied in the employees receiving such awards. Recipients of restricted stock grants
market prices of traded options to be a good indicator of future accumulate dividends and can vote during the vesting period, but
volatility because remaining maturities of traded options are less than forfeit their awards and accumulated dividends if their employment
one year. The risk-free interest rate is derived using the four-year U.S. terminates before the vesting date. Awards of restricted stock units are
Treasury bond yield rate as of the award date for the primary grant. generally limited to overseas employees. A restricted stock unit
Expected option life reflects the Company’s historical experience. represents a right to receive a common share of stock when the unit
vests. Recipients of restricted stock units are entitled to accumulate
Restricted stock. The Company awards restricted stock to its hypothetical dividends, but cannot vote during the vesting period.
employees or directors with vesting periods ranging from two to five They forfeit their units and accumulated dividends if their
years. These awards are generally in one of two forms: restricted stock employment terminates before the vesting date.
grants or restricted stock units. Restricted stock grants are the most
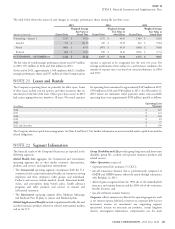
The table below shows the status of, and changes in, restricted stock grants and units during the last three years:
2015 2014 2013
Weighted Average Weighted Average Weighted Average
Fair Value at Fair Value at Fair Value at
(Awards in thousands)
Grants/Units Award Date Grants/Units Award Date Grants/Units Award Date
Outstanding – January 1 2,121 $ 53.59 2,844 $ 41.56 4,064 $ 35.00
Awarded 352 $ 121.93 454 $ 78.99 525 $ 59.36
Vested (736) $ 41.99 (1,065) $ 32.34 (1,480) $ 30.24
Forfeited (95) $ 68.31 (112) $ 52.95 (265) $ 39.46
OUTSTANDING – DECEMBER 31 1,642 $ 72.58 2,121 $ 53.59 2,844 $ 41.56
The fair value of vested restricted stock was: $92 million in 2015, performance shares are divided into two broad groups: 50% are
$85 million in 2014 and $94 million in 2013. subject to a market condition (total shareholder return relative to
industry peer companies) and 50% are subject to performance
At the end of 2015, approximately 3,900 employees held 1.6 million conditions (2013 and 2014 awards: revenue growth and cumulative
restricted stock grants and units with $56 million of related adjusted net income; 2015 awards, cumulative adjusted net income).
compensation expense to be recognized over the next two years These targets are set by the Committee. At the end of the performance
(weighted average period). period, holders of strategic performance shares will be awarded
anywhere from 0 to 200% of the original grant of strategic
Strategic Performance Shares. The Company awards strategic performance shares in Cigna common stock.
performance shares to executives and certain other key employees
generally with a performance period of three years. Strategic
104 CIGNA CORPORATION - 2015 Form 10-K