Cigna 2015 Annual Report Download - page 69
Download and view the complete annual report
Please find page 69 of the 2015 Cigna annual report below. You can navigate through the pages in the report by either clicking on the pages listed below, or by using the keyword search tool below to find specific information within the annual report.-
 1
1 -
2
-
3
-
4
-
5
-
6
-
7
-
8
-
9
-
10
-
11
-
12
-
13
-
14
-
15
-
16
-
17
-
18
-
19
-
20
-
21
-
22
-
23
-
24
-
25
-
26
-
27
-
28
-
29
-
30
-
31
-
32
-
33
-
34
-
35
-
36
-
37
-
38
-
39
-
40
-
41
-
42
-
43
-
44
-
45
-
46
-
47
-
48
-
49
-
50
-
51
-
52
-
53
-
54
-
55
-
56
-
57
-
58
-
 59
59 -
 60
60 -
 61
61 -
 62
62 -
 63
63 -
 64
64 -
 65
65 -
 66
66 -
 67
67 -
 68
68 -
 69
69 -
 70
70 -
 71
71 -
 72
72 -
 73
73 -
 74
74 -
 75
75 -
 76
76 -
 77
77 -
 78
78 -
 79
79 -
80
-
81
-
82
-
83
-
84
-
85
-
86
-
87
-
88
-
89
-
90
-
91
-
92
-
93
-
94
-
95
-
96
-
97
-
98
-
99
-
100
-
101
-
102
-
103
-
104
-
105
-
106
-
107
-
108
-
109
-
110
-
111
-
112
-
113
-
114
-
115
-
116
-
117
-
118
-
119
-
120
-
121
-
122
-
123
-
124
-
125
-
126
-
127
-
128
-
129
-
130
-
131
-
132
-
133
-
134
-
135
-
136
-
137
-
138
-
139
-
140
-
141
-
142
-
143
-
144
-
145
-
146
-
147
-
148
-
149
-
150
-
151
-
152
-
153
-
154
-
155
-
156
-
157
-
158
-
159
-
160
-
161
-
162
-
163
-
164
-
165
-
166
-
167
-
168
-
169
-
170
-
171
-
172
-
173
-
174
-
175
-
176
-
177
-
178
-
179
-
180
 |
 |
PART II
ITEM 7. Management’s Discussion and Analysis of Financial Condition and Results of Operations
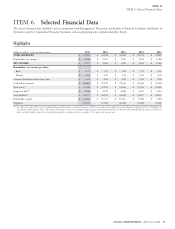
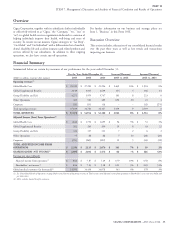
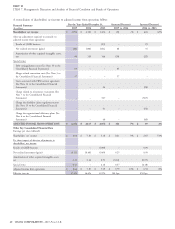
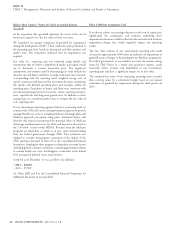
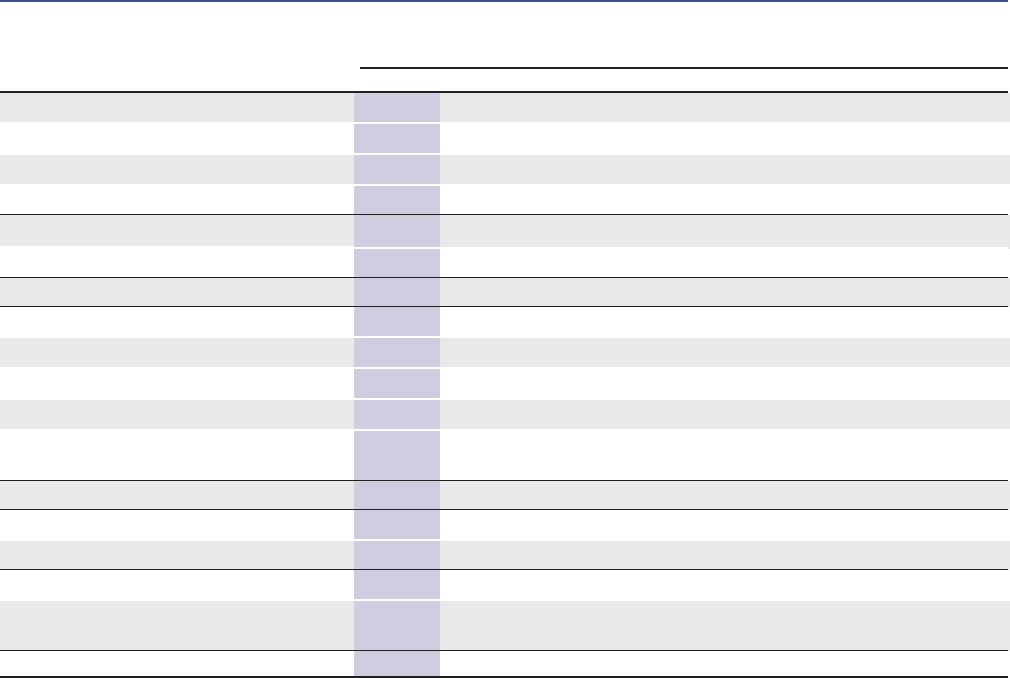
Consolidated Results of Operations
Summarized below are our results of operations on a GAAP basis.
For the Years Ended December 31, Increase/(Decrease) Increase/(Decrease)
Financial Summary
(In millions)
2015 2014 2013 2015 vs. 2014 2014 vs. 2013
Premiums $ 29,642 $ 27,214 $ 25,575 $ 2,428 9% $ 1,639 6%
Fees and other revenues 4,488 4,141 3,601 347 8 540 15
Net investment income 1,153 1,166 1,164 (13) (1) 2 –
Mail order pharmacy revenues 2,536 2,239 1,827 297 13 412 23
Operating revenues 37,819 34,760 32,167 3,059 9 2,593 8
Net realized investment gains 57 154 213 (97) (63) (59) (28)
Total revenues 37,876 34,914 32,380 2,962 8 2,534 8
Global Health Care medical costs 18,354 16,694 15,867 1,660 10 827 5
Other benefit expenses 4,936 4,640 4,998 296 6 (358) (7)
Mail order pharmacy costs 2,134 1,907 1,509 227 12 398 26
Other operating expenses 8,982 8,174 7,595 808 10 579 8
Amortization of other acquired intangible assets,
net 143 195 235 (52) (27) (40) (17)
Benefits and expenses 34,549 31,610 30,204 2,939 9 1,406 5
Income before income taxes 3,327 3,304 2,176 23 1 1,128 52
Income taxes 1,250 1,210 698 40 3 512 73
Net income 2,077 2,094 1,478 (17) (1) 616 42
Less: net income (loss) attributable to
noncontrolling interests (17) (8) 2 (9) (113) (10) N/M
Shareholders’ net income $ 2,094 $ 2,102 $ 1,476 $ (8) –% $ 626 42%
CIGNA CORPORATION - 2015 Form 10-K 39