Cigna 2015 Annual Report Download - page 110
Download and view the complete annual report
Please find page 110 of the 2015 Cigna annual report below. You can navigate through the pages in the report by either clicking on the pages listed below, or by using the keyword search tool below to find specific information within the annual report.-
 1
1 -
2
-
3
-
4
-
5
-
6
-
7
-
8
-
9
-
10
-
11
-
12
-
13
-
14
-
15
-
16
-
17
-
18
-
19
-
20
-
21
-
22
-
23
-
24
-
25
-
26
-
27
-
28
-
29
-
30
-
31
-
32
-
33
-
34
-
35
-
36
-
37
-
38
-
39
-
40
-
41
-
42
-
43
-
44
-
45
-
46
-
47
-
48
-
49
-
50
-
51
-
52
-
53
-
54
-
55
-
56
-
57
-
58
-
59
-
60
-
61
-
62
-
63
-
64
-
65
-
66
-
67
-
68
-
69
-
70
-
71
-
72
-
73
-
74
-
75
-
76
-
77
-
78
-
79
-
80
-
81
-
82
-
83
-
84
-
85
-
86
-
87
-
88
-
89
-
90
-
91
-
92
-
93
-
94
-
95
-
96
-
97
-
98
-
99
-
 100
100 -
 101
101 -
 102
102 -
 103
103 -
 104
104 -
 105
105 -
 106
106 -
 107
107 -
 108
108 -
 109
109 -
 110
110 -
 111
111 -
 112
112 -
 113
113 -
 114
114 -
 115
115 -
 116
116 -
 117
117 -
 118
118 -
 119
119 -
 120
120 -
121
-
122
-
123
-
124
-
125
-
126
-
127
-
128
-
129
-
130
-
131
-
132
-
133
-
134
-
135
-
136
-
137
-
138
-
139
-
140
-
141
-
142
-
143
-
144
-
145
-
146
-
147
-
148
-
149
-
150
-
151
-
152
-
153
-
154
-
155
-
156
-
157
-
158
-
159
-
160
-
161
-
162
-
163
-
164
-
165
-
166
-
167
-
168
-
169
-
170
-
171
-
172
-
173
-
174
-
175
-
176
-
177
-
178
-
179
-
180
 |
 |

PART II
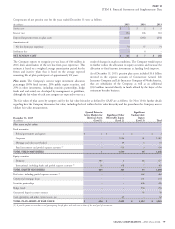
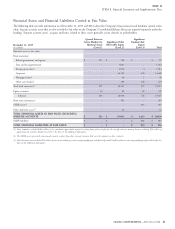
ITEM 8. Financial Statements and Supplementary Data
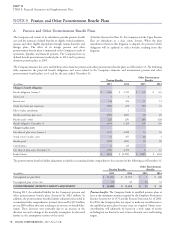
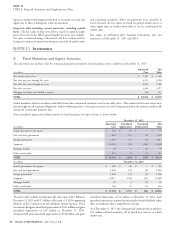
Quoted Prices in Significant
Active Markets for Significant Other Unobservable
Identical Assets Observable Inputs Inputs
December 31, 2014
(In millions)
(Level 1) (Level 2) (Level 3) Total
Plan assets at fair value:
Fixed maturities:
Federal government and agency $ 1 $ 1 $ – $ 2
Corporate – 1,025 35 1,060
Mortgage and other asset-backed – 21 3 24
Fund investments and pooled separate accounts
(1)
– 744 3 747
TOTAL FIXED MATURITIES 1 1,791 41 1,833
Equity securities:
Domestic 640 5 73 718
International, including funds and pooled separate accounts
(1)
131 241 7 379
TOTAL EQUITY SECURITIES 771 246 80 1,097
Real estate, including pooled separate accounts
(1)
– – 331 331
Commercial mortgage loans – – 110 110
Securities partnerships – – 357 357
Hedge funds – – 283 283
Guaranteed deposit account contract – – 44 44
Cash equivalents and other current assets, net – 115 – 115
TOTAL PLAN ASSETS AT FAIR VALUE $ 772 $ 2,152 $ 1,246 $ 4,170
(1) A pooled separate account has several participating benefit plans and each owns a share of the total pool of investments.
Plan assets in Level 1 include exchange-listed equity securities. Level 2 Plan assets classified in Level 3 include investments primarily in
assets primarily include: securities partnerships, equity real estate and hedge funds generally
valued based on the pension plan’s ownership share of the equity of
fixed income and international equity funds priced using their daily the investee including changes in the fair values of its underlying
net asset value that is the exit price; and investments.
fixed maturities valued using recent trades of similar securities or
pricing models as described in Note 10.
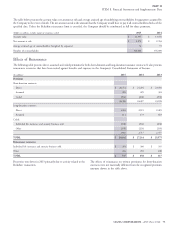
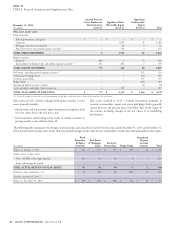
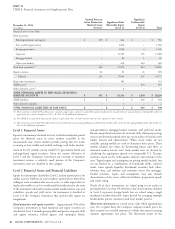
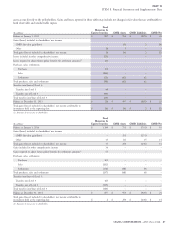
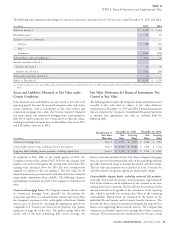
The following table summarizes the changes in pension plan assets classified in Level 3 for the years ended December 31, 2015 and December 31,
2014. Actual return on plan assets in this table may include changes in fair value that are attributable to both observable and unobservable inputs.
Fixed Guaranteed
Maturities Real Estate Deposit
& Equity & Mortgage Securities Account
(In millions)
Securities Loans Partnerships Hedge Funds Contract Total
Balance at January 1, 2015 $ 121 $ 441 $ 357 $ 283 $ 44 $ 1,246
Actual return on plan assets:
Assets still held at the reporting date (3) 58 50 4 1 110
Assets sold during the period – – – – – –
TOTAL ACTUAL RETURN ON PLAN ASSETS (3) 58 50 4 1 110
Purchases, sales, settlements, net 14 (6) (1) (31) 13 (11)
Transfers into/out of Level 3 7 – – – – 7
Balance at December 31, 2015 $ 139 $ 493 $ 406 $ 256 $ 58 $ 1,352
80 CIGNA CORPORATION - 2015 Form 10-K
•
•