Cigna 2015 Annual Report Download - page 138
Download and view the complete annual report
Please find page 138 of the 2015 Cigna annual report below. You can navigate through the pages in the report by either clicking on the pages listed below, or by using the keyword search tool below to find specific information within the annual report.-
 1
1 -
2
-
3
-
4
-
5
-
6
-
7
-
8
-
9
-
10
-
11
-
12
-
13
-
14
-
15
-
16
-
17
-
18
-
19
-
20
-
21
-
22
-
23
-
24
-
25
-
26
-
27
-
28
-
29
-
30
-
31
-
32
-
33
-
34
-
35
-
36
-
37
-
38
-
39
-
40
-
41
-
42
-
43
-
44
-
45
-
46
-
47
-
48
-
49
-
50
-
51
-
52
-
53
-
54
-
55
-
56
-
57
-
58
-
59
-
60
-
61
-
62
-
63
-
64
-
65
-
66
-
67
-
68
-
69
-
70
-
71
-
72
-
73
-
74
-
75
-
76
-
77
-
78
-
79
-
80
-
81
-
82
-
83
-
84
-
85
-
86
-
87
-
88
-
89
-
90
-
91
-
92
-
93
-
94
-
95
-
96
-
97
-
98
-
99
-
100
-
101
-
102
-
103
-
104
-
105
-
106
-
107
-
108
-
109
-
110
-
111
-
112
-
113
-
114
-
115
-
116
-
117
-
118
-
119
-
120
-
121
-
122
-
123
-
124
-
125
-
126
-
127
-
 128
128 -
 129
129 -
 130
130 -
 131
131 -
 132
132 -
 133
133 -
 134
134 -
 135
135 -
 136
136 -
 137
137 -
 138
138 -
 139
139 -
 140
140 -
 141
141 -
 142
142 -
 143
143 -
 144
144 -
 145
145 -
 146
146 -
 147
147 -
 148
148 -
149
-
150
-
151
-
152
-
153
-
154
-
155
-
156
-
157
-
158
-
159
-
160
-
161
-
162
-
163
-
164
-
165
-
166
-
167
-
168
-
169
-
170
-
171
-
172
-
173
-
174
-
175
-
176
-
177
-
178
-
179
-
180
 |
 |

PART II
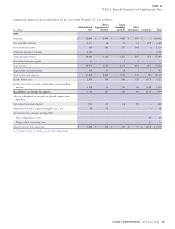
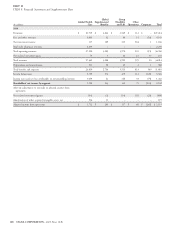
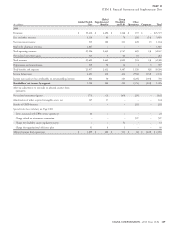
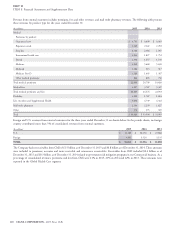
ITEM 8. Financial Statements and Supplementary Data
Global Group
Global Health Supplemental Disability Other
(In millions)
Care Benefits and Life Operations Corporate Total
2014
Premiums $ 20,709 $ 2,844 $ 3,549 $ 112 $ – $27,214
Fees and other revenues 4,005 52 86 14 (16) 4,141
Net investment income 337 109 335 384 1 1,166
Mail order pharmacy revenues 2,239 – – – – 2,239
Total operating revenues 27,290 3,005 3,970 510 (15) 34,760
Net realized investment gains 79 3 22 15 35 154
Total revenues 27,369 3,008 3,992 525 20 34,914
Depreciation and amortization 513 50 22 2 1 588
Total benefits and expenses 24,610 2,734 3,513 413 340 31,610
Income before taxes 2,759 274 479 112 (320) 3,304
Income taxes and net loss attributable to noncontrolling interests 1,059 41 148 33 (79) 1,202
Shareholders’ net income by segment 1,700 233 331 79 (241) 2,102
After-tax adjustments to reconcile to adjusted income from
operations:
Net realized investment (gains) (54) (3) (14) (11) (24) (106)
Amortization of other acquired intangible assets, net 106 13 – – – 119
Adjusted income from operations $ 1,752 $ 243 $ 317 $ 68 $ (265) $ 2,115
108 CIGNA CORPORATION - 2015 Form 10-K