Cigna 2015 Annual Report Download - page 111
Download and view the complete annual report
Please find page 111 of the 2015 Cigna annual report below. You can navigate through the pages in the report by either clicking on the pages listed below, or by using the keyword search tool below to find specific information within the annual report.-
 1
1 -
2
-
3
-
4
-
5
-
6
-
7
-
8
-
9
-
10
-
11
-
12
-
13
-
14
-
15
-
16
-
17
-
18
-
19
-
20
-
21
-
22
-
23
-
24
-
25
-
26
-
27
-
28
-
29
-
30
-
31
-
32
-
33
-
34
-
35
-
36
-
37
-
38
-
39
-
40
-
41
-
42
-
43
-
44
-
45
-
46
-
47
-
48
-
49
-
50
-
51
-
52
-
53
-
54
-
55
-
56
-
57
-
58
-
59
-
60
-
61
-
62
-
63
-
64
-
65
-
66
-
67
-
68
-
69
-
70
-
71
-
72
-
73
-
74
-
75
-
76
-
77
-
78
-
79
-
80
-
81
-
82
-
83
-
84
-
85
-
86
-
87
-
88
-
89
-
90
-
91
-
92
-
93
-
94
-
95
-
96
-
97
-
98
-
99
-
100
-
 101
101 -
 102
102 -
 103
103 -
 104
104 -
 105
105 -
 106
106 -
 107
107 -
 108
108 -
 109
109 -
 110
110 -
 111
111 -
 112
112 -
 113
113 -
 114
114 -
 115
115 -
 116
116 -
 117
117 -
 118
118 -
 119
119 -
 120
120 -
 121
121 -
122
-
123
-
124
-
125
-
126
-
127
-
128
-
129
-
130
-
131
-
132
-
133
-
134
-
135
-
136
-
137
-
138
-
139
-
140
-
141
-
142
-
143
-
144
-
145
-
146
-
147
-
148
-
149
-
150
-
151
-
152
-
153
-
154
-
155
-
156
-
157
-
158
-
159
-
160
-
161
-
162
-
163
-
164
-
165
-
166
-
167
-
168
-
169
-
170
-
171
-
172
-
173
-
174
-
175
-
176
-
177
-
178
-
179
-
180
 |
 |

PART II
ITEM 8. Financial Statements and Supplementary Data
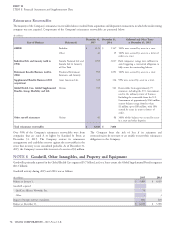
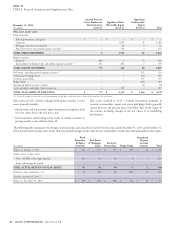
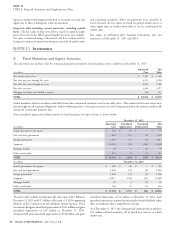
Fixed Guaranteed
Maturities Real Estate Deposit
& Equity & Mortgage Securities Account
(In millions)
Securities Loans Partnerships Hedge Funds Contract Total
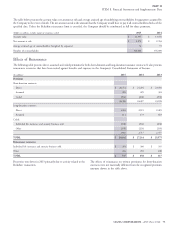
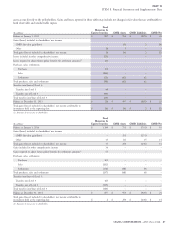
Balance at January 1, 2014 $ 74 $ 339 $ 304 $ 360 $ 44 $ 1,121
Actual return on plan assets:
Assets still held at the reporting date 1 41 40 17 2 101
Assets sold during the period – – – – – –
TOTAL ACTUAL RETURN ON PLAN ASSETS 1 41 40 17 2 101
Purchases, sales, settlements, net 44 61 13 (94) (2) 22
Transfers into/out of Level 3 2 – – – – 2
Balance at December 31, 2014 $ 121 $ 441 $ 357 $ 283 $ 44 $ 1,246
Other postretirement benefits. The Company’s pre-tax expense for postretirement medical plan. Changes in the estimated rate of future
these plans was $8 million for 2015, $9 million for 2014 and $(11) increases in the per capital cost of health care benefits would have no
million for 2013. The 2013 benefit was primarily due to a pre-tax material effect on postretirement benefit costs or obligations.
curtailment gain of $19 million resulting from the freeze of the
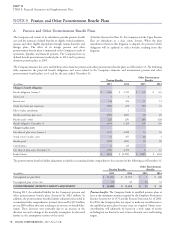
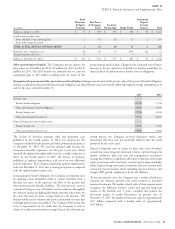
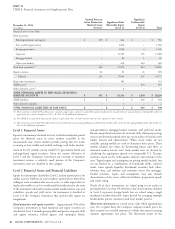
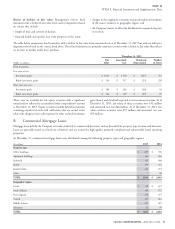
Assumptions for pension and other postretirement benefit plans. Management determined the present value of the projected benefit obligation
and the accumulated other postretirement benefit obligation and related benefit costs based on the following weighted average assumptions as of
and for the years ended December 31:
2015 2014
Discount rate:
Pension benefit obligation 4.17% 3.75%
Other postretirement benefit obligation 3.89% 3.50%
Pension benefit cost 3.75% 4.50%
Other postretirement benefit cost 3.50% 4.00%
Expected long-term return on plan assets:
Pension benefit cost 7.25% 7.25%
Other postretirement benefit cost 5.00% 5.00%
The Society of Actuaries mortality table and projection scale setting process, the Company reviewed alternative indices and
published in the fourth quarter of 2014 was adopted for the determined that they were not materially different than the result
Company’s defined benefit pension and other postretirement plans as produced by the curve used.
of December 31, 2014. We used the updated table because the Expected long-term rates of return on plan assets were developed
Company’s mortality experience over the past several years closely considering actual long-term historical returns, expected long-term
matched the updated mortality table based on a study conducted in market conditions, plan asset mix and management’s investment
2014. In the fourth quarter of 2015, the Society of Actuaries strategy that continues a significant allocation to domestic and foreign
published an updated improvement scale based on two additional equity securities as well as real estate, securities partnerships and hedge
years of experience. The Company adopted the updated improvement funds. Expected long-term market conditions take into consideration
scale as of December 31, 2015 after reviewing its experience compared certain key macroeconomic trends including expected domestic and
with the updated improvement scale. foreign GDP growth, employment levels and inflation.
In measuring the benefit obligation, the Company sets discount rates To measure pension costs, the Company uses a market-related asset
by applying actual annualized yields at various durations from a valuation for domestic pension plan assets invested in non-fixed
discount rate curve to the expected cash flows of the pension and income investments. The market-related value of these pension assets
other postretirement benefits liabilities. The discount rate curve is recognizes the difference between actual and expected long-term
constructed using an array of bonds in various industries throughout returns in the portfolio over 5 years, a method that reduces the
the domestic market for high quality bonds, but only selects those for short-term impact of market fluctuations on pension cost. At
the curve that have an above average return at each duration. The December 31, 2015, the market-related asset value was approximately
bond portfolio used to construct the curve is monitored to ensure that $3.9 billion compared with a market value of approximately
only high quality issues are included. The Company believes that this $4.0 billion.
curve is representative of the yields that the Company is able to
achieve in its plan asset investment strategy. As part of its discount rate
CIGNA CORPORATION - 2015 Form 10-K 81