Cigna 2015 Annual Report Download - page 103
Download and view the complete annual report
Please find page 103 of the 2015 Cigna annual report below. You can navigate through the pages in the report by either clicking on the pages listed below, or by using the keyword search tool below to find specific information within the annual report.-
 1
1 -
2
-
3
-
4
-
5
-
6
-
7
-
8
-
9
-
10
-
11
-
12
-
13
-
14
-
15
-
16
-
17
-
18
-
19
-
20
-
21
-
22
-
23
-
24
-
25
-
26
-
27
-
28
-
29
-
30
-
31
-
32
-
33
-
34
-
35
-
36
-
37
-
38
-
39
-
40
-
41
-
42
-
43
-
44
-
45
-
46
-
47
-
48
-
49
-
50
-
51
-
52
-
53
-
54
-
55
-
56
-
57
-
58
-
59
-
60
-
61
-
62
-
63
-
64
-
65
-
66
-
67
-
68
-
69
-
70
-
71
-
72
-
73
-
74
-
75
-
76
-
77
-
78
-
79
-
80
-
81
-
82
-
83
-
84
-
85
-
86
-
87
-
88
-
89
-
90
-
91
-
92
-
 93
93 -
 94
94 -
 95
95 -
 96
96 -
 97
97 -
 98
98 -
 99
99 -
 100
100 -
 101
101 -
 102
102 -
 103
103 -
 104
104 -
 105
105 -
 106
106 -
 107
107 -
 108
108 -
 109
109 -
 110
110 -
 111
111 -
 112
112 -
 113
113 -
114
-
115
-
116
-
117
-
118
-
119
-
120
-
121
-
122
-
123
-
124
-
125
-
126
-
127
-
128
-
129
-
130
-
131
-
132
-
133
-
134
-
135
-
136
-
137
-
138
-
139
-
140
-
141
-
142
-
143
-
144
-
145
-
146
-
147
-
148
-
149
-
150
-
151
-
152
-
153
-
154
-
155
-
156
-
157
-
158
-
159
-
160
-
161
-
162
-
163
-
164
-
165
-
166
-
167
-
168
-
169
-
170
-
171
-
172
-
173
-
174
-
175
-
176
-
177
-
178
-
179
-
180
 |
 |

PART II
ITEM 8. Financial Statements and Supplementary Data
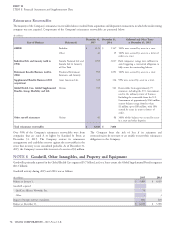
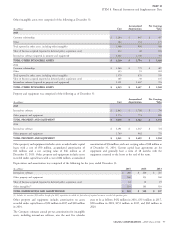
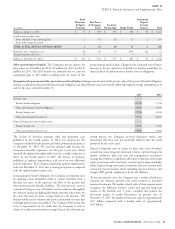
Global Health Care Medical Costs Payable
Medical costs payable for the Global Health Care segment reflects estimates of the ultimate cost of claims that have been incurred but not yet
reported, those that have been reported but not yet paid (reported costs in process), and other medical expenses payable that are primarily
comprised of accruals for incentives and other amounts payable to health care professionals and facilities, as follows:
(In millions)
2015 2014
Incurred but not yet reported $ 1,757 $ 1,777
Reported costs in process 470 288
Physician incentives and other medical care expense and services payable 128 115
MEDICAL COSTS PAYABLE $ 2,355 $ 2,180
Activity in medical costs payable was as follows:
(In millions)
2015 2014 2013
Balance at January 1, $ 2,180 $ 2,050 $ 1,856
Less: Reinsurance and other amounts recoverable 252 194 242
Balance at January 1, net 1,928 1,856 1,614
Incurred costs related to:
Current year 18,564 16,853 16,049
Prior years (210) (159) (182)
Total incurred 18,354 16,694 15,867
Paid costs related to:
Current year 16,588 14,966 14,267
Prior years 1,582 1,656 1,358
Total paid 18,170 16,622 15,625
Balance at December 31, net 2,112 1,928 1,856
Add: Reinsurance and other amounts recoverable 243 252 194
Balance at December 31, $ 2,355 $ 2,180 $ 2,050
Reinsurance and other amounts recoverable reflect amounts due from December 31, 2013. Actual completion factors accounted for
reinsurers and policyholders to cover incurred but not reported and $61 million of favorability, or 0.4%, while actual medical cost trend
pending claims for minimum premium products and certain ASO resulted in the remaining $98 million, or 0.6%.
business where the right of offset does not exist. See Note 7 for The impact of prior year development on shareholders’ net income
additional information on reinsurance. For the year ended was $60 million for the year ended December 31, 2015 compared
December 31, 2015, actual experience differed from the Company’s with $53 million for the year ended December 31, 2014. The
key assumptions resulting in favorable incurred costs related to prior favorable effect of prior year development for both years primarily
years’ medical costs payable of $210 million, or 1.3% of the current reflects low utilization of medical services. Incurred costs related to
year incurred costs as reported for the year ended December 31, 2014. prior years in the table above do not directly correspond to an increase
Actual completion factors accounted for $62 million, or 0.4%, while or decrease to shareholders’ net income. The primary reason for the
actual medical cost trend resulted in $115 million, or 0.7%. The difference is that decreases to prior year incurred costs pertaining to
remaining $33 million, or 0.2%, was primarily related to an increase the portion of the liability established for moderately adverse
in the 2014 reinsurance reimbursement rate from CMS under Health conditions are not considered as impacting shareholders’ net income if
Care Reform. they are offset by increases in the current year provision for moderately
For the year ended December 31, 2014, actual experience differed adverse conditions. The determination of liabilities for Global Health
from the Company’s key assumptions, resulting in favorable incurred Care medical costs payable requires the Company to make critical
costs related to prior years’ medical costs payable of $159 million, or accounting estimates. See Note 2(N) for further information about
1.0% of the current year incurred costs as reported for the year ended the assumptions and estimates used to establish this liability.
CIGNA CORPORATION - 2015 Form 10-K 73
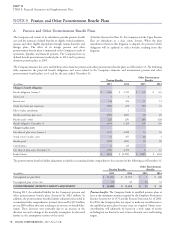
NOTE 5