Cigna 2015 Annual Report Download - page 130
Download and view the complete annual report
Please find page 130 of the 2015 Cigna annual report below. You can navigate through the pages in the report by either clicking on the pages listed below, or by using the keyword search tool below to find specific information within the annual report.-
 1
1 -
2
-
3
-
4
-
5
-
6
-
7
-
8
-
9
-
10
-
11
-
12
-
13
-
14
-
15
-
16
-
17
-
18
-
19
-
20
-
21
-
22
-
23
-
24
-
25
-
26
-
27
-
28
-
29
-
30
-
31
-
32
-
33
-
34
-
35
-
36
-
37
-
38
-
39
-
40
-
41
-
42
-
43
-
44
-
45
-
46
-
47
-
48
-
49
-
50
-
51
-
52
-
53
-
54
-
55
-
56
-
57
-
58
-
59
-
60
-
61
-
62
-
63
-
64
-
65
-
66
-
67
-
68
-
69
-
70
-
71
-
72
-
73
-
74
-
75
-
76
-
77
-
78
-
79
-
80
-
81
-
82
-
83
-
84
-
85
-
86
-
87
-
88
-
89
-
90
-
91
-
92
-
93
-
94
-
95
-
96
-
97
-
98
-
99
-
100
-
101
-
102
-
103
-
104
-
105
-
106
-
107
-
108
-
109
-
110
-
111
-
112
-
113
-
114
-
115
-
116
-
117
-
118
-
119
-
 120
120 -
 121
121 -
 122
122 -
 123
123 -
 124
124 -
 125
125 -
 126
126 -
 127
127 -
 128
128 -
 129
129 -
 130
130 -
 131
131 -
 132
132 -
 133
133 -
 134
134 -
 135
135 -
 136
136 -
 137
137 -
 138
138 -
 139
139 -
 140
140 -
141
-
142
-
143
-
144
-
145
-
146
-
147
-
148
-
149
-
150
-
151
-
152
-
153
-
154
-
155
-
156
-
157
-
158
-
159
-
160
-
161
-
162
-
163
-
164
-
165
-
166
-
167
-
168
-
169
-
170
-
171
-
172
-
173
-
174
-
175
-
176
-
177
-
178
-
179
-
180
 |
 |

PART II
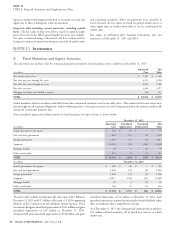
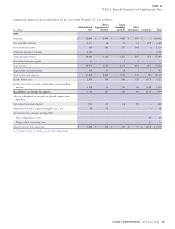
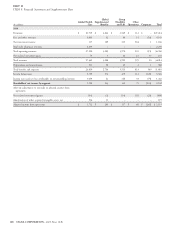
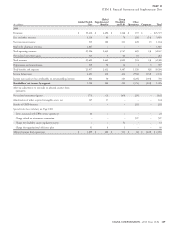
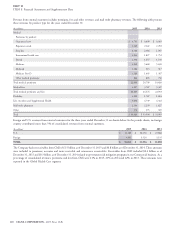
ITEM 8. Financial Statements and Supplementary Data
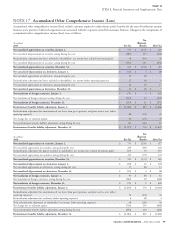
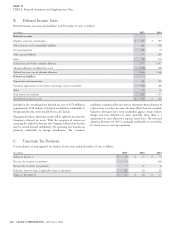
Tax
(In millions)
(Expense)
2013 Pre-Tax Benefit After-Tax
Net unrealized appreciation on securities, January 1, $ 1,352 $ (465) $ 887
Net unrealized (depreciation) on securities arising during the year (498) 166 (332)
Reclassification adjustment for (gains) included in net income (net realized investment gains) (121) 43 (78)
Net unrealized (depreciation) on securities arising during the year (619) 209 (410)
Net unrealized appreciation on securities, December 31, $ 733 $ (256) $ 477
Net unrealized depreciation on derivatives, January 1, $ (43) $ 15 $ (28)
Net unrealized appreciation on derivatives arising during the year 14 (5) 9
Net unrealized depreciation on derivatives, December 31, $ (29) $ 10 $ (19)
Net translation of foreign currencies, January 1, $ 91 $ (22) $ 69
Net translation of foreign currencies arising during the year – 13 13
Net translation of foreign currencies, December 31, $91$(9)$82
Postretirement benefits liability adjustment, January 1, $ (2,460) $ 861 $ (1,599)
Reclassification adjustment for amortization of net losses from past experience and prior service costs (other
operating expenses) 70 (25) 45
Reclassification adjustment for curtailment gain (other operating expenses) (19) 7 (12)
Total reclassification adjustment to shareholders’ net income (other operating expenses) 51 (18) 33
Net change due to valuation update and plan amendments 779 (273) 506
Net postretirement benefits liability adjustment arising during the year 830 (291) 539
Postretirement benefits liability adjustment, December 31, $ (1,630) $ 570 $ (1,060)
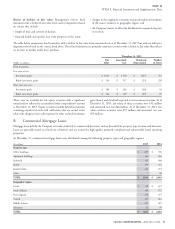
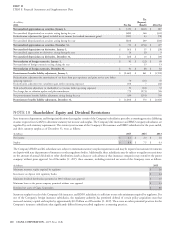
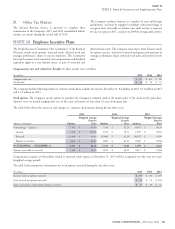
Shareholders’ Equity and Dividend Restrictions
State insurance departments and foreign jurisdictions that regulate certain of the Company’s subsidiaries prescribe accounting practices (differing
in some respects from GAAP) to determine statutory net income and surplus. The Company’s life insurance and HMO company subsidiaries are
regulated by such statutory requirements. The statutory net income of the Company’s life insurance and HMO subsidiaries for the years ended,
and their statutory surplus as of December 31, were as follows:
(In billions)
2015 2014 2013
Net income $ 2.1 $ 2.0 $ 1.6
Surplus $ 8.0 $ 7.5 $ 6.3
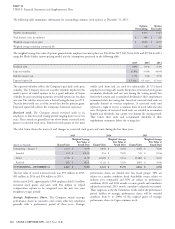
The Company’s HMO and life subsidiaries are subject to minimum statutory surplus requirements and may be required to maintain investments
on deposit with state departments of insurance or other regulatory bodies. Additionally, these subsidiaries may be subject to regulatory restrictions
on the amount of annual dividends or other distributions (such as loans or cash advances) that insurance companies may extend to the parent
company without prior approval. As of December 31, 2015, these amounts, including restricted net assets of the Company, were as follows:
(In billions)
2015
Minimum statutory surplus required by regulators $ 2.6
Investments on deposit with regulatory bodies $ 0.4
Maximum dividend distributions permitted in 2016 without state approval $ 1.5
Maximum loans to the parent company permitted without state approval $ 1.3
Restricted net assets of Cigna Corporation $ 8.6
Statutory surplus for each of the Company’s life insurance and HMO subsidiaries is sufficient to meet the minimum required by regulators. For
one of the Company’s foreign insurance subsidiaries, the regulatory authority has permitted deferral of certain policy acquisition costs that
increased statutory capital and surplus by approximately $0.2 billion as of December 31, 2015. There were no other permitted practices for the
Company’s insurance subsidiaries that significantly differed from prescribed regulatory accounting practices.
100 CIGNA CORPORATION - 2015 Form 10-K
NOTE 18