Cigna 2015 Annual Report Download - page 135
Download and view the complete annual report
Please find page 135 of the 2015 Cigna annual report below. You can navigate through the pages in the report by either clicking on the pages listed below, or by using the keyword search tool below to find specific information within the annual report.-
 1
1 -
2
-
3
-
4
-
5
-
6
-
7
-
8
-
9
-
10
-
11
-
12
-
13
-
14
-
15
-
16
-
17
-
18
-
19
-
20
-
21
-
22
-
23
-
24
-
25
-
26
-
27
-
28
-
29
-
30
-
31
-
32
-
33
-
34
-
35
-
36
-
37
-
38
-
39
-
40
-
41
-
42
-
43
-
44
-
45
-
46
-
47
-
48
-
49
-
50
-
51
-
52
-
53
-
54
-
55
-
56
-
57
-
58
-
59
-
60
-
61
-
62
-
63
-
64
-
65
-
66
-
67
-
68
-
69
-
70
-
71
-
72
-
73
-
74
-
75
-
76
-
77
-
78
-
79
-
80
-
81
-
82
-
83
-
84
-
85
-
86
-
87
-
88
-
89
-
90
-
91
-
92
-
93
-
94
-
95
-
96
-
97
-
98
-
99
-
100
-
101
-
102
-
103
-
104
-
105
-
106
-
107
-
108
-
109
-
110
-
111
-
112
-
113
-
114
-
115
-
116
-
117
-
118
-
119
-
120
-
121
-
122
-
123
-
124
-
 125
125 -
 126
126 -
 127
127 -
 128
128 -
 129
129 -
 130
130 -
 131
131 -
 132
132 -
 133
133 -
 134
134 -
 135
135 -
 136
136 -
 137
137 -
 138
138 -
 139
139 -
 140
140 -
 141
141 -
 142
142 -
 143
143 -
 144
144 -
 145
145 -
146
-
147
-
148
-
149
-
150
-
151
-
152
-
153
-
154
-
155
-
156
-
157
-
158
-
159
-
160
-
161
-
162
-
163
-
164
-
165
-
166
-
167
-
168
-
169
-
170
-
171
-
172
-
173
-
174
-
175
-
176
-
177
-
178
-
179
-
180
 |
 |
PART II
ITEM 8. Financial Statements and Supplementary Data
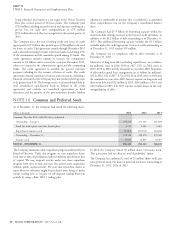
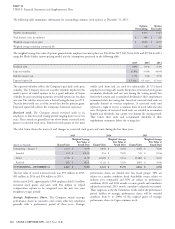
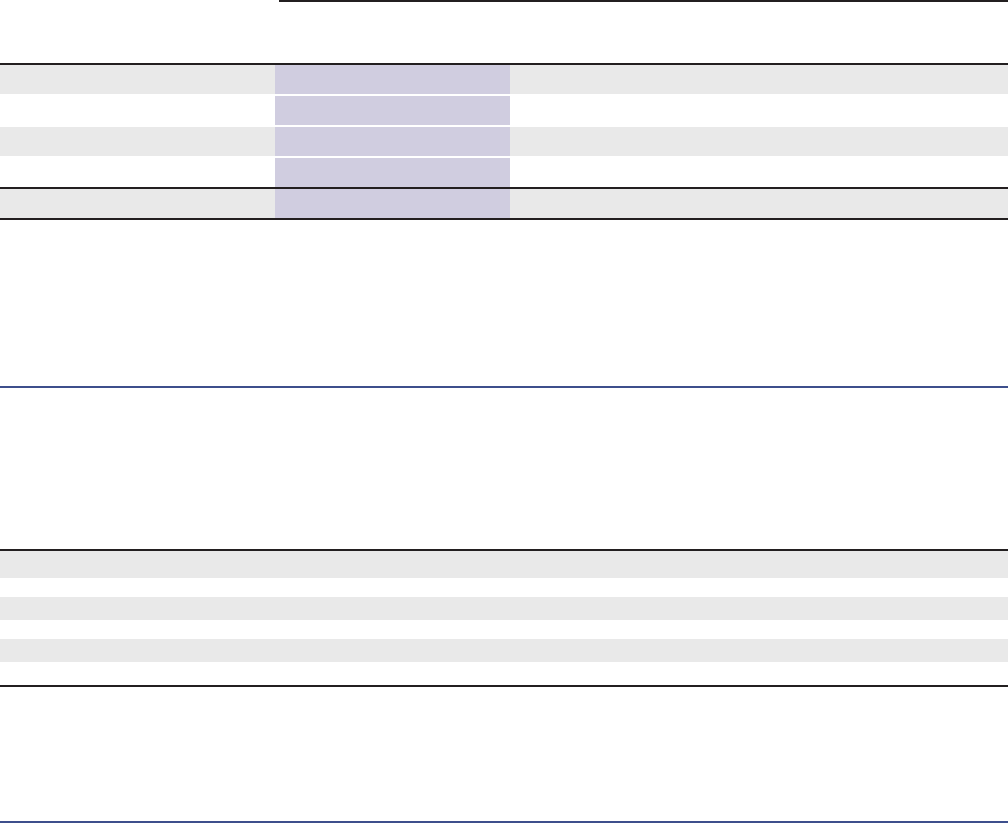
The table below shows the status of, and changes in, strategic performance shares during the last three years:
2015 2014 2013
Weighted Average Weighted Average Weighted Average
Fair Value at Fair Value at Fair Value at
(Awards in thousands)
Grants/Units Award Date Grants/Units Award Date Grants/Units Award Date
Outstanding – January 1 1,547 $ 59.20 1,572 $ 49.67 1,600 $ 41.92
Awarded 311 $ 121.78 450 $ 78.50 616 $ 59.84
Vested (608) $ 45.51 (397) $ 43.53 (448) $ 36.88
Forfeited (62) $ 76.33 (78) $ 58.41 (196) $ 47.52
OUTSTANDING – DECEMBER 31 1,188 $ 81.68 1,547 $ 59.20 1,572 $ 49.67
The fair value of vested strategic performance shares was $119 million expense is expected to be recognized over the next two years. For
in 2015, $57 million in 2014 and $42 million in 2013. strategic performance shares subject to a performance condition, the
amount of expense may vary based on actual performance in 2016
At the end of 2015, approximately 1,300 employees held 1.2 million and 2017.
strategic performance shares and $37 million of related compensation
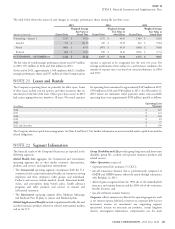
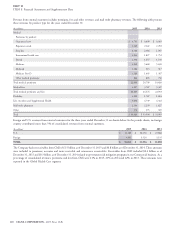
Leases and Rentals
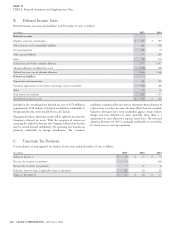
The Company’s operating leases are primarily for office space. Some for operating leases amounted to approximately $165 million in 2015,
of these leases include renewal options and other incentives that are $150 million in 2014 and $140 million in 2013. As of December 31,
amortized over the life of the lease. Office space leases active in 2015 2015, future net minimum rental payments under non-cancelable
had terms ranging from one month to 18 years. Net rental expenses operating leases were approximately $700 million, payable as follows:
Operating Lease
(In millions)
Payments
2016 $ 127
2017 $ 121
2018 $ 100
2019 $85
2020 $77
2021 and thereafter $ 190
The Company also has capital lease arrangements. See Note 8 and Note 15 for further information on assets recorded under capital leases and the
related obligations.
Segment Information
The financial results of the Company’s businesses are reported in the Group Disability and Life provides group long-term and short-term
following segments: disability, group life, accident and specialty insurance products and
related services.
Global Health Care aggregates the Commercial and Government
operating segments due to their similar economic characteristics, Other Operations consist of:
products and services and regulatory environment: corporate-owned life insurance (‘‘COLI’’);
The Commercial operating segment encompasses both the U.S. run-off reinsurance business that is predominantly comprised of
commercial and certain international health care businesses serving GMDB and GMIB business effectively exited through reinsurance
employers and their employees, other groups, and individuals. with Berkshire in 2013;
Products and services include medical, dental, behavioral health, deferred gains recognized from the 1998 sale of the individual life
vision, and prescription drug benefit plans, health advocacy insurance and annuity business and the 2004 sale of the retirement
programs and other products and services to insured and benefits business; and
self-insured customers. run-off settlement annuity business.
The Government operating segment offers Medicare Advantage Corporate reflects amounts not allocated to operating segments, such
and Medicare Part D plans to seniors and Medicaid plans. as net interest expense (defined as interest on corporate debt less net
Global Supplemental Benefits includes supplemental health, life and investment income on investments not supporting segment
accident insurance products offered in selected international markets operations), interest on uncertain tax positions, certain litigation
and in the U.S. matters, intersegment eliminations, compensation cost for stock
CIGNA CORPORATION - 2015 Form 10-K 105
NOTE 21
NOTE 22
•
••
•
•
•