CVS 2013 Annual Report Download - page 94
Download and view the complete annual report
Please find page 94 of the 2013 CVS annual report below. You can navigate through the pages in the report by either clicking on the pages listed below, or by using the keyword search tool below to find specific information within the annual report.-
 1
1 -
2
-
3
-
4
-
5
-
6
-
7
-
8
-
9
-
10
-
11
-
12
-
13
-
14
-
15
-
16
-
17
-
18
-
19
-
20
-
21
-
22
-
23
-
24
-
25
-
26
-
27
-
28
-
29
-
30
-
31
-
32
-
33
-
34
-
35
-
36
-
37
-
38
-
39
-
40
-
41
-
42
-
43
-
44
-
45
-
46
-
47
-
48
-
49
-
50
-
51
-
52
-
53
-
54
-
55
-
56
-
57
-
58
-
59
-
60
-
61
-
62
-
63
-
64
-
65
-
66
-
67
-
68
-
69
-
70
-
71
-
72
-
73
-
74
-
75
-
76
-
77
-
78
-
79
-
80
-
81
-
82
-
83
-
 84
84 -
 85
85 -
 86
86 -
 87
87 -
 88
88 -
 89
89 -
 90
90 -
 91
91 -
 92
92 -
 93
93 -
 94
94 -
 95
95 -
 96
96
 |
 |
92
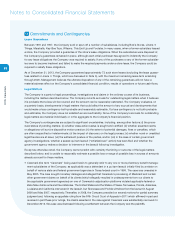
CVS Caremark
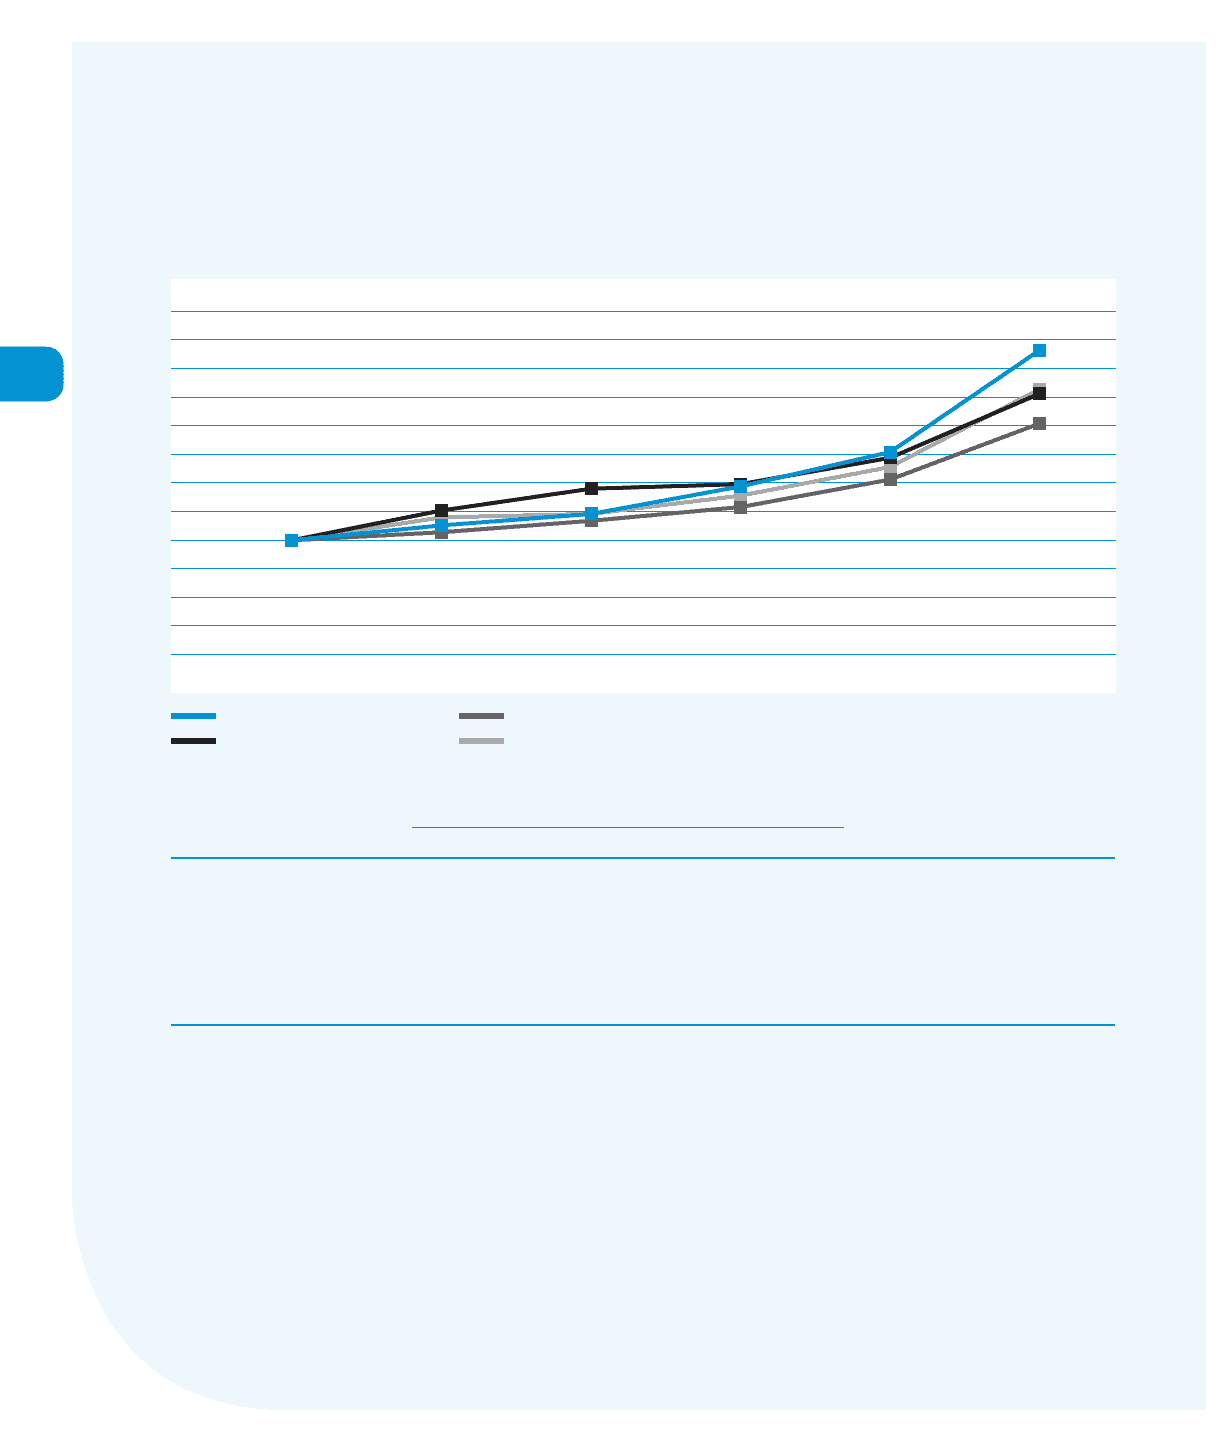
Stock Performance Graph
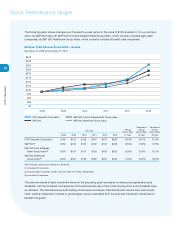
The following graph shows changes over the past five-year period in the value of $100 invested in: (1) our common
stock; (2) S&P 500 Index; (3) S&P 500 Food and Staples Retail Group Index, which currently includes eight retail
companies; (4) S&P 500 Healthcare Group Index, which currently includes 55 health care companies.
Relative Total Returns Since 2008 – Annual
December 31, 2008 to December 31, 2013
Compound Compound
Annual Annual Annual
Year End Return Rate Return Rate Return Rate
2008 2009 2010 2011 2012 2013 (1 Year) (3 Year) (5 Year)
CVS Caremark Corporation $100 $113 $123 $147 $177 $266 50.4% 29.1% 21.6%
S&P 500 (1) $100 $126 $145 $149 $172 $228 32.4% 16.2% 17.9%
S&P 500 Food & Staples
Retail Group Index (2) $100 $107 $117 $129 $153 $202 32.6% 20.0% 15.1%
S&P 500 Healthcare
Group Index (3) $100 $120 $123 $139 $164 $232 41.5% 23.4% 18.3%
Note: Analysis assumes reinvestment of dividends.
(1) Includes CVS Caremark.
(2) Includes eight companies: (COST, CVS, KR, SWY, SYY, WAG, WFM, WMT).
(3) Includes 55 companies.
CVS Caremark Corporation
S&P 500
S&P 500 Food & Staples Retail Group Index
S&P 500 Healthcare Group Index
$300
$200
$225
$250
$275
$150
$175
$125
$100
$75
$50
$25
$0
2008 2009 2010 2011 2012 2013
The year-end values of each investment shown in the preceding graph are based on share price appreciation plus
dividends, with the dividends reinvested as of the last business day of the month during which such dividends were
ex-dividend. The calculations exclude trading commissions and taxes. Total stockholder returns from each invest-
ment, whether measured in dollars or percentages, can be calculated from the year-end investment values shown
beneath the graph.