CVS 2013 Annual Report Download - page 92
Download and view the complete annual report
Please find page 92 of the 2013 CVS annual report below. You can navigate through the pages in the report by either clicking on the pages listed below, or by using the keyword search tool below to find specific information within the annual report.-
 1
1 -
2
-
3
-
4
-
5
-
6
-
7
-
8
-
9
-
10
-
11
-
12
-
13
-
14
-
15
-
16
-
17
-
18
-
19
-
20
-
21
-
22
-
23
-
24
-
25
-
26
-
27
-
28
-
29
-
30
-
31
-
32
-
33
-
34
-
35
-
36
-
37
-
38
-
39
-
40
-
41
-
42
-
43
-
44
-
45
-
46
-
47
-
48
-
49
-
50
-
51
-
52
-
53
-
54
-
55
-
56
-
57
-
58
-
59
-
60
-
61
-
62
-
63
-
64
-
65
-
66
-
67
-
68
-
69
-
70
-
71
-
72
-
73
-
74
-
75
-
76
-
77
-
78
-
79
-
80
-
81
-
 82
82 -
 83
83 -
 84
84 -
 85
85 -
 86
86 -
 87
87 -
 88
88 -
 89
89 -
 90
90 -
 91
91 -
 92
92 -
 93
93 -
 94
94 -
 95
95 -
 96
96
 |
 |
90
CVS Caremark
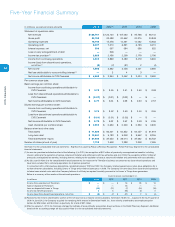
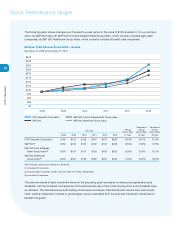
Five-Year Financial Summary
In millions,
except per share amounts
2013 2012 (4) 2011 2010 2009
Statement of operations data:
Net revenues
$ 126,761
$ 123,120 $ 107,080 $ 95,766 $ 98,144
Gross profit
23,783
22,488 20,562 20,215 20,348
Operating expenses
15,746
15,278 14,231 14,082 13,933
Operating profit
8,037
7,210 6,331 6,133 6,415
Interest expense, net
509
557 584 536 525
Loss on early extinguishment of debt
—
348 — — —
Income tax provision (1)
2,928
2,436 2,258 2,178 2,196
Income from continuing operations
4,600
3,869 3,489 3,419 3,694
Income (loss) from discontinued operations,
net of tax (2)
(8)
(7) (31) 2 (4)
Net income
4,592
3,862 3,458 3,421 3,690
Net loss attributable to noncontrolling interest (3)
—
2 4 3 —
Net income attributable to CVS Caremark
$ 4,592
$ 3,864 $ 3,462 $ 3,424 $ 3,690
Per common share data:
Basic earnings per common share:
Income from continuing operations attributable to
CVS Caremark
$ 3.78
$ 3.05 $ 2.61 $ 2.50 $ 2.58
Loss from discontinued operations attributable to
CVS Caremark
$ (0.01)
$ (0.01) $ (0.02) $ — $ —
Net income attributable to CVS Caremark
$ 3.77
$ 3.04 $ 2.59 $ 2.50 $ 2.57
Diluted earnings per common share:
Income from continuing operations attributable to
CVS Caremark
$ 3.75
$ 3.02 $ 2.59 $ 2.49 $ 2.55
Loss from discontinued operations attributable to
CVS Caremark
$ (0.01)
$ (0.01) $ (0.02) $ — $ —
Net income attributable to CVS Caremark
$ 3.74
$ 3.02 $ 2.57 $ 2.49 $ 2.55
Cash dividends per common share
$ 0.900
$ 0.650 $ 0.500 $ 0.350 $ 0.305
Balance sheet and other data:
Total assets
$ 71,526
$ 66,221 $ 64,852 $ 62,457 $ 61,919
Long-term debt
$ 12,841
$ 9,133 $ 9,208 $ 8,652 $ 8,755
Total shareholders’ equity
$ 37,938
$ 37,653 $ 38,014 $ 37,662 $ 35,732
Number of stores (at end of year)
7,702
7,508 7,388 7,248 7,095
See Note 1 to the consolidated financial statements – Significant Accounting Policies (Revenue Recognition – Retail Pharmacy Segment) to the consolidated
financial statements.
(1) Income tax provision includes the effect of the following: (i) in 2010, the recognition of $47 million of previously unrecognized tax benefits, including
interest, relating to the expiration of various statutes of limitation and settlements with tax authorities and (ii) in 2009, the recognition of $167 million of
previously unrecognized tax benefits, including interest, relating to the expiration of various statutes of limitation and settlements with tax authorities.
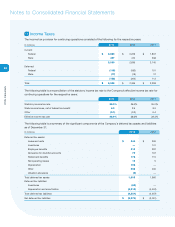
(2) As discussed in Note 3 to the consolidated financial statements, the results of the TheraCom business are presented as discontinued operations and
have been excluded from continuing operations for all periods presented.
In connection with certain business dispositions completed between 1991 and 1997, the Company retained guarantees on store lease obligations for a
number of former subsidiaries, including Linens ‘n Things which filed for bankruptcy in 2008. The Company’s income (loss) from discontinued operations
includes lease-related costs which the Company believes it will likely be required to satisfy pursuant to its Linens ‘n Things lease guarantees.
Below is a summary of the results of discontinued operations:
YEAR ENDED DECEMBER 31,
In millions
2013 2012 2011 2010 2009
Income from operations of TheraCom
$ —
$ — $ 18 $ 28 $ 13
Gain on disposal of TheraCom
—
— 53 — —
Loss on disposal of Linens ‘n Things
(12)
(12) (7) (24) (19)
Income tax benefit (provision)
4
5 (95) (2) 2
Income (loss) from discontinued operations, net of tax
$ (8)
$ (7) $ (31) $ 2 $ (4)
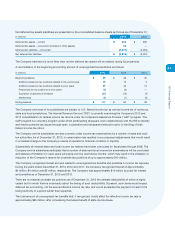
(3) Represents the minority shareholders’ portion of the net loss from our majority owned subsidiary, Generation Health, Inc., acquired in the fourth quarter of
2009. In June 2012, the Company acquired the remaining 40% interest in Generation Health, Inc. from minority shareholders and employee option
holders for $26 million and $5 million, respectively, for a total of $31 million.
(4) Effective January 1, 2012, the Company changed its methods of accounting for prescription drug inventories in the Retail Pharmacy Segment. Additional
details of the accounting change are discussed in Note 2 to the consolidated financial statements.