CVS 2013 Annual Report Download - page 89
Download and view the complete annual report
Please find page 89 of the 2013 CVS annual report below. You can navigate through the pages in the report by either clicking on the pages listed below, or by using the keyword search tool below to find specific information within the annual report.-
 1
1 -
2
-
3
-
4
-
5
-
6
-
7
-
8
-
9
-
10
-
11
-
12
-
13
-
14
-
15
-
16
-
17
-
18
-
19
-
20
-
21
-
22
-
23
-
24
-
25
-
26
-
27
-
28
-
29
-
30
-
31
-
32
-
33
-
34
-
35
-
36
-
37
-
38
-
39
-
40
-
41
-
42
-
43
-
44
-
45
-
46
-
47
-
48
-
49
-
50
-
51
-
52
-
53
-
54
-
55
-
56
-
57
-
58
-
59
-
60
-
61
-
62
-
63
-
64
-
65
-
66
-
67
-
68
-
69
-
70
-
71
-
72
-
73
-
74
-
75
-
76
-
77
-
78
-
 79
79 -
 80
80 -
 81
81 -
 82
82 -
 83
83 -
 84
84 -
 85
85 -
 86
86 -
 87
87 -
 88
88 -
 89
89 -
 90
90 -
 91
91 -
 92
92 -
 93
93 -
 94
94 -
 95
95 -
 96
96
 |
 |

87
2013 Annual Report
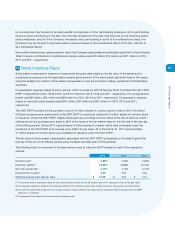
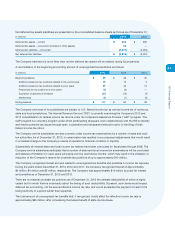
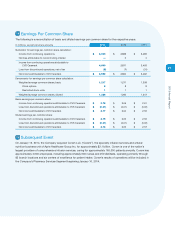
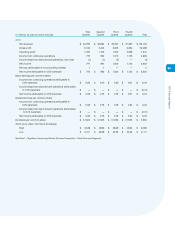
14 Earnings Per Common Share
The following is a reconciliation of basic and diluted earnings per common share for the respective years:
In millions, except per share amounts
2013 2012 2011
Numerator for earnings per common share calculation:
Income from continuing operations
$ 4,600
$ 3,869 $ 3,489
Net loss attributable to noncontrolling interest
—
2 4
Income from continuing operations attributable to
CVS Caremark
4,600
3,871 3,493
Loss from discontinued operations, net of tax
(8)
(7) (31)
Net income attributable to CVS Caremark
$ 4,592
$ 3,864 $ 3,462
Denominator for earnings per common share calculation:
Weighted average common shares, basic
1,217
1,271 1,338
Stock options
8
8 8
Restricted stock units
1
1 1
Weighted average common shares, diluted
1,226
1,280 1,347
Basic earnings per common share:
Income from continuing operations attributable to CVS Caremark
$ 3.78
$ 3.05 $ 2.61
Loss from discontinued operations attributable to CVS Caremark
$ (0.01)
$ (0.01) $ (0.02)
Net income attributable to CVS Caremark
$ 3.77
$ 3.04 $ 2.59
Diluted earnings per common share:
Income from continuing operations attributable to CVS Caremark
$ 3.75
$ 3.02 $ 2.59
Loss from discontinued operations attributable to CVS Caremark
$ (0.01)
$ (0.01) $ (0.02)
Net income attributable to CVS Caremark
$ 3.74
$ 3.02 $ 2.57
15 Subsequent Event
On January 16, 2014, the Company acquired Coram LLC (“Coram”), the specialty infusion services and enteral
nutrition business unit of Apria Healthcare Group Inc. for approximately $2.1 billion. Coram is one of the nation’s
largest providers of comprehensive infusion services, caring for approximately 165,000 patients annually. Coram has
approximately 4,600 employees, including approximately 600 nurses and 250 dietitians, operating primarily through
85 branch locations and six centers of excellence for patient intake. Coram’s results of operations will be included in
the Company’s Pharmacy Services Segment beginning January 16, 2014.