CVS 2013 Annual Report Download - page 28
Download and view the complete annual report
Please find page 28 of the 2013 CVS annual report below. You can navigate through the pages in the report by either clicking on the pages listed below, or by using the keyword search tool below to find specific information within the annual report.-
 1
1 -
2
-
3
-
4
-
5
-
6
-
7
-
8
-
9
-
10
-
11
-
12
-
13
-
14
-
15
-
16
-
17
-
 18
18 -
 19
19 -
 20
20 -
 21
21 -
 22
22 -
 23
23 -
 24
24 -
 25
25 -
 26
26 -
 27
27 -
 28
28 -
 29
29 -
 30
30 -
 31
31 -
 32
32 -
 33
33 -
 34
34 -
 35
35 -
 36
36 -
 37
37 -
 38
38 -
39
-
40
-
41
-
42
-
43
-
44
-
45
-
46
-
47
-
48
-
49
-
50
-
51
-
52
-
53
-
54
-
55
-
56
-
57
-
58
-
59
-
60
-
61
-
62
-
63
-
64
-
65
-
66
-
67
-
68
-
69
-
70
-
71
-
72
-
73
-
74
-
75
-
76
-
77
-
78
-
79
-
80
-
81
-
82
-
83
-
84
-
85
-
86
-
87
-
88
-
89
-
90
-
91
-
92
-
93
-
94
-
95
-
96
 |
 |

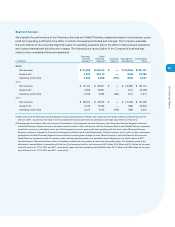
Management’s Discussion and Analysis
of Financial Condition and Results of Operations
26
CVS Caremark
Results of Operations
Summary of Our Consolidated Financial Results
YEAR ENDED DECEMBER 31,
In millions, except per common share amounts
2013 2012 2011
Net revenues
$ 126,761
$ 123,120 $ 107,080
Cost of revenues
102,978
100,632 86,518
Gross profit
23,783
22,488 20,562
Operating expenses
15,746
15,278 14,231
Operating profit
8,037
7,210 6,331
Interest expense, net
509
557 584
Loss on early extinguishment of debt
—
348 —
Income before income tax provision
7,528
6,305 5,747
Income tax provision
2,928
2,436 2,258
Income from continuing operations
4,600
3,869 3,489
Loss from discontinued operations, net of tax
(8)
(7) (31)
Net income
4,592
3,862 3,458
Net loss attributable to noncontrolling interest
—
2 4
Net income attributable to CVS Caremark
$ 4,592
$ 3,864 $ 3,462
Diluted earnings per common share:
Income from continuing operations attributable to CVS Caremark
$ 3.75
$ 3.02 $ 2.59
Loss from discontinued operations attributable to CVS Caremark
$ (0.01)
$ (0.01) $ (0.02)
Net income attributable to CVS Caremark
$ 3.74
$ 3.02 $ 2.57
Net revenues
increased $3.6 billion in 2013 compared to 2012, and increased $16.0 billion in 2012 compared to 2011.
As you review our performance in this area, we believe you should consider the following important information:
• During 2013, net revenues in our Pharmacy Services Segment increased 3.8% and net revenues in our Retail
Pharmacy Segment increased 3.1% compared to the prior year.
• During 2012, net revenues in our Pharmacy Services Segment increased by 24.7% and net revenues in our Retail
Pharmacy Segment increased 6.8% compared to the prior year.
• The increase in our generic dispensing rates in both of our operating segments continued to have an adverse effect
on net revenue in 2013 as compared to 2012, as well as in 2012 as compared to 2011. In 2012, the Pharmacy
Services Segment had a greater impact from net new business as compared to 2013.
Please see the Segment Analysis later in this document for additional information about our net revenues.
Gross profit
increased $1.3 billion, or 5.8% in 2013, to $23.8 billion, or 18.8% of net revenues, as compared to
$22.5 billion, or 18.3% of net revenues in 2012. Gross profit increased $1.9 billion, or 9.4% in 2012, to $22.5 billion,
or 18.3% of net revenues, as compared to $20.6 billion, or 19.2% of net revenues in 2011.