CVS 2013 Annual Report Download - page 30
Download and view the complete annual report
Please find page 30 of the 2013 CVS annual report below. You can navigate through the pages in the report by either clicking on the pages listed below, or by using the keyword search tool below to find specific information within the annual report.-
 1
1 -
2
-
3
-
4
-
5
-
6
-
7
-
8
-
9
-
10
-
11
-
12
-
13
-
14
-
15
-
16
-
17
-
18
-
19
-
 20
20 -
 21
21 -
 22
22 -
 23
23 -
 24
24 -
 25
25 -
 26
26 -
 27
27 -
 28
28 -
 29
29 -
 30
30 -
 31
31 -
 32
32 -
 33
33 -
 34
34 -
 35
35 -
 36
36 -
 37
37 -
 38
38 -
 39
39 -
 40
40 -
41
-
42
-
43
-
44
-
45
-
46
-
47
-
48
-
49
-
50
-
51
-
52
-
53
-
54
-
55
-
56
-
57
-
58
-
59
-
60
-
61
-
62
-
63
-
64
-
65
-
66
-
67
-
68
-
69
-
70
-
71
-
72
-
73
-
74
-
75
-
76
-
77
-
78
-
79
-
80
-
81
-
82
-
83
-
84
-
85
-
86
-
87
-
88
-
89
-
90
-
91
-
92
-
93
-
94
-
95
-
96
 |
 |

Management’s Discussion and Analysis
of Financial Condition and Results of Operations
28
CVS Caremark
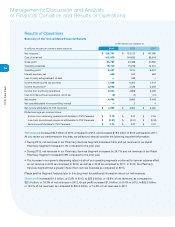
Income tax provision –
Our effective income tax rate was 38.9%, 38.6% and 39.3% in 2013, 2012 and 2011,
respectively. The effective income tax was higher in 2013 than in 2012 primarily due to certain permanent items in
2012. These same items were the principal factors for the lower effective income tax rate in 2012 compared to 2011.
Income from continuing operations
increased $731 million or 18.9% to $4.6 billion in 2013. Income from continuing
operations increased $380 million or 10.9% to $3.9 billion in 2012 as compared to $3.5 billion in 2011. The 2013
increase in income from continuing operations was primarily related to increases in generic dispensing rates for both
operating segments, increased volume across all channels in our Pharmacy Services Segment, as well as increased
sales in the Retail Pharmacy Segment.
Loss from discontinued operations –
In connection with certain business dispositions completed between 1991
and 1997, the Company retained guarantees on store lease obligations for a number of former subsidiaries, including
Linens ‘n Things, which filed for bankruptcy in 2008. The Company’s loss from discontinued operations includes
lease-related costs which the Company believes it will likely be required to satisfy pursuant to its Linens ‘n Things
lease guarantees.
We incurred a loss from discontinued operations of $8 million in 2013, a loss from discontinued operations of
$7 million in 2012 and a loss from discontinued operations of $31 million in 2011. The loss from discontinued operations
in 2013 and 2012 was primarily due to costs related to Linens ‘n Things lease guarantees. The loss from discontin-
ued operations in 2011 was primarily due to the disposition of our TheraCom subsidiary. We recognized a $53 million
pre-tax gain and a $37 million after-tax loss on the sale of TheraCom. The after-tax loss was caused by the income
tax treatment of TheraCom’s nondeductible goodwill.
See Note 3 “Discontinued Operations” to the consolidated financial statements for additional information about
discontinued operations and Note 12 “Commitments and Contingencies” for additional information about our lease
guarantees.
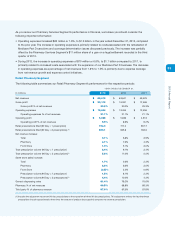
Net loss attributable to noncontrolling interest
represents the minority shareholders’ portion of the net loss from our
subsidiary, Generation Health, Inc., prior to June 2012. We acquired the remaining 40% interest of Generation Health,
Inc. on June 29, 2012 and as a result, there was no longer a noncontrolling interest in Generation Health, Inc. for the
year ended December 31, 2013. The net loss attributable to noncontrolling interest for the years ended December 31,
2012 and 2011 was $2 million and $4 million, respectively.
Net income attributable to CVS Caremark
increased $728 million or 18.8% to $4.6 billion (or $3.74 per diluted
share) in 2013. This compares to $3.9 billion (or $3.02 per diluted share) in 2012 and $3.5 billion (or $2.57 per diluted
share) in 2011. As discussed previously, the 2013 increase in net income attributable to CVS Caremark was primarily
related to increased generic drug dispensing in both operating segments, increased volume across all channels in
our Pharmacy Services Segment, and increased sales in our Retail Pharmacy Segment. The increase in net income
attributable to CVS Caremark per diluted share was also driven by increased share repurchase activity in 2013
and 2012.