CVS 2013 Annual Report Download - page 78
Download and view the complete annual report
Please find page 78 of the 2013 CVS annual report below. You can navigate through the pages in the report by either clicking on the pages listed below, or by using the keyword search tool below to find specific information within the annual report.-
 1
1 -
2
-
3
-
4
-
5
-
6
-
7
-
8
-
9
-
10
-
11
-
12
-
13
-
14
-
15
-
16
-
17
-
18
-
19
-
20
-
21
-
22
-
23
-
24
-
25
-
26
-
27
-
28
-
29
-
30
-
31
-
32
-
33
-
34
-
35
-
36
-
37
-
38
-
39
-
40
-
41
-
42
-
43
-
44
-
45
-
46
-
47
-
48
-
49
-
50
-
51
-
52
-
53
-
54
-
55
-
56
-
57
-
58
-
59
-
60
-
61
-
62
-
63
-
64
-
65
-
66
-
67
-
 68
68 -
 69
69 -
 70
70 -
 71
71 -
 72
72 -
 73
73 -
 74
74 -
 75
75 -
 76
76 -
 77
77 -
 78
78 -
 79
79 -
 80
80 -
 81
81 -
 82
82 -
 83
83 -
 84
84 -
 85
85 -
 86
86 -
 87
87 -
 88
88 -
89
-
90
-
91
-
92
-
93
-
94
-
95
-
96
 |
 |

76
CVS Caremark
Notes to Consolidated Financial Statements
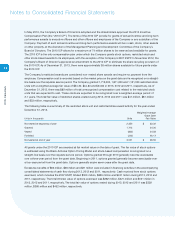
Pursuant to various labor agreements, the Company also contributes to multiemployer health and welfare plans that
cover certain union-represented employees. The plans provide postretirement health care and life insurance benefits
to certain employees who meet eligibility requirements. Total Company contributions to multiemployer health and
welfare plans were $55 million, $50 million and $47 million in 2013, 2012 and 2011, respectively.
Pension Plans
During the year ended December 31, 2013, the Company sponsored ten defined benefit pension plans. Four of the
plans are tax-qualified plans that are funded based on actuarial calculations and applicable federal laws and regula-
tions. The other six plans are unfunded nonqualified supplemental retirement plans. Most of the plans were frozen in
prior periods. During the years ended December 31, 2012 and 2011, the Company had a total of nine defined benefit
pension plans.
As of December 31, 2013, the Company’s pension plans had a projected benefit obligation of $694 million and plan
assets of $568 million. As of December 31, 2012, the Company’s pension plans had a projected benefit obligation
of $758 million and plan assets of $527 million. Actual return on plan assets was $49 million and $62 million in 2013
and 2012, respectively. Net periodic pension costs related to these pension plans were $19 million, $31 million and
$49 million in 2013, 2012 and 2011, respectively. The net periodic pension costs for 2012 include a curtailment loss
of $2 million. The net periodic pension costs for 2011 include a settlement loss of $25 million due to the impact of
lump sum payouts.
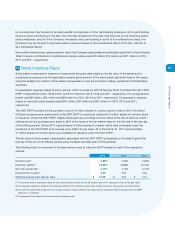
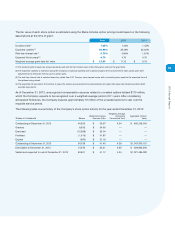
The discount rate is determined by examining the current yields observed on the measurement date of fixed-interest,
high quality investments expected to be available during the period to maturity of the related benefits on a plan by
plan basis. The discount rate for the plans was 4.75% in 2013 and 4.0% in 2012. The expected long-term rate of
return on plan assets is determined by using the plan’s target allocation and historical returns for each asset class
on a plan by plan basis. The expected long-term rate of return for all plans was 7.25% in 2013, 2012 and 2011.
Historically, the Company used an investment strategy which emphasized equities in order to produce higher
expected returns, and in the long run, lower expected expense and cash contribution requirements. The qualified
pension plan asset allocation targets were 50% equity and 50% fixed income for 2012 and 2011. Beginning in 2013,
the Company changed its investment strategy to be liability management driven. The qualified pension plan asset
allocation targets in 2013 were revised to hold more fixed income investments based on the change in the investment
strategy. Investment allocations for the four qualified defined benefit plans range from 60% to 85% in fixed income
and 15% to 40% in equities as of December 31, 2013.
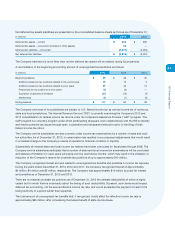
As of December 31, 2013, the Company’s qualified defined benefit pension plan assets consisted of 23% equity,
76% fixed income and 1% money market securities of which 17% were classified as Level 1 and 83% as Level 2
in the fair value hierarchy. The Company’s qualified defined benefit pension plan assets as of December 31, 2012
consisted of 50% equity, 48% fixed income and 2% money market securities of which 84% were classified as Level
1 and 16% as Level 2 in the fair value hierarchy.
The Company contributed $33 million, $36 million and $92 million to the pension plans during 2013, 2012 and 2011,
respectively. The Company plans to make approximately $41 million in contributions to the pension plans during 2014.
The Company also contributes to a number of multiemployer pension plans under the terms of collective-bargaining
agreements that cover its union-represented employees. The risks of participating in these multiemployer plans are
different from single-employer pension plans in the following aspects: (i) assets contributed to the multiemployer plan