CVS 2013 Annual Report Download - page 38
Download and view the complete annual report
Please find page 38 of the 2013 CVS annual report below. You can navigate through the pages in the report by either clicking on the pages listed below, or by using the keyword search tool below to find specific information within the annual report.-
 1
1 -
2
-
3
-
4
-
5
-
6
-
7
-
8
-
9
-
10
-
11
-
12
-
13
-
14
-
15
-
16
-
17
-
18
-
19
-
20
-
21
-
22
-
23
-
24
-
25
-
26
-
27
-
 28
28 -
 29
29 -
 30
30 -
 31
31 -
 32
32 -
 33
33 -
 34
34 -
 35
35 -
 36
36 -
 37
37 -
 38
38 -
 39
39 -
 40
40 -
 41
41 -
 42
42 -
 43
43 -
 44
44 -
 45
45 -
 46
46 -
 47
47 -
 48
48 -
49
-
50
-
51
-
52
-
53
-
54
-
55
-
56
-
57
-
58
-
59
-
60
-
61
-
62
-
63
-
64
-
65
-
66
-
67
-
68
-
69
-
70
-
71
-
72
-
73
-
74
-
75
-
76
-
77
-
78
-
79
-
80
-
81
-
82
-
83
-
84
-
85
-
86
-
87
-
88
-
89
-
90
-
91
-
92
-
93
-
94
-
95
-
96
 |
 |

Management’s Discussion and Analysis
of Financial Condition and Results of Operations
36
CVS Caremark
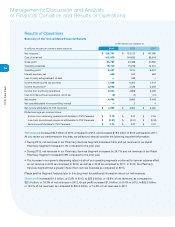
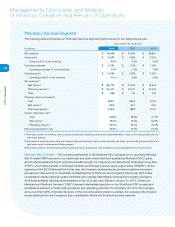
Operating expenses
in our Retail Pharmacy Segment include store payroll, store employee benefits, store occu-
pancy costs, selling expenses, advertising expenses, depreciation and amortization expense and certain
administrative expenses.
Operating expenses increased $389 million, or 2.9% to $13.8 billion, or 21.1% as a percentage of net revenues, in
the year ended December 31, 2013, as compared to $13.5 billion, or 21.1% as a percentage of net revenues, in the
prior year. Operating expenses increased $899 million, or 7.2%, to $13.5 billion, or 21.1% as a percentage of net
revenues, in the year ended December 31, 2012, as compared to $12.6 billion, or 21.1% as a percentage of net
revenues, in the prior year. Operating expenses as a percentage of net revenues remained consistent from 2011
through 2013 primarily due to disciplined cost control, despite the negative impact of generics on net revenues.
The increase in operating expense dollars in 2013 and 2012 was the result of higher store operating costs associated
with our increased store count. The increase was partially offset by the Retail Pharmacy Segment’s $61 million share
of a gain on a legal settlement recorded in the third quarter of 2013.
Corporate Segment
Operating expenses
increased $57 million, or 8.3%, to $751 million in the year ended December 31, 2013, as
compared to the prior year. Operating expenses increased $78 million, or 12.5%, to $694 million in the year ended
December 31, 2012. Operating expenses within the Corporate Segment include executive management, corporate
relations, legal, compliance, human resources, corporate information technology and finance related costs. The
increase in operating expenses in 2013 was primarily due to higher benefit costs and strategic initiatives. The increase
in operating expenses in 2012 was primarily due to higher benefit costs and information technology expenses.
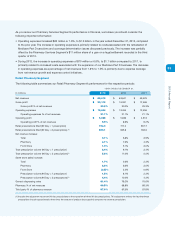
Liquidity and Capital Resources
We maintain a level of liquidity sufficient to allow us to cover our cash needs in the short-term. Over the long-term,
we manage our cash and capital structure to maximize shareholder return, maintain our financial position and
maintain flexibility for future strategic initiatives. We continuously assess our working capital needs, debt and lever-
age levels, capital expenditure requirements, dividend payouts, potential share repurchases and future investments
or acquisitions. We believe our operating cash flows, commercial paper program, sale-leaseback program, as well
as any potential future borrowings, will be sufficient to fund these future payments and long-term initiatives.
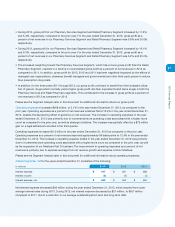
Net cash provided by operating activities
was $5.8 billion for the year ended December 31, 2013, compared to
$6.7 billion in 2012, and $5.9 billion in 2011. The decrease in 2013 was primarily due to increased accounts receiv-
able due to the timing of payments from CMS in connection with our Medicare Part D operations, partially offset by
improved inventory management. The increase in 2012 was primarily due to the significant increase in net income,
improved receivables management, improved payables management, and the timing of payments.
Net cash used in investing activities
was $1.8 billion in 2013 and 2012. This compares to approximately $2.4 billion
in 2011. The decrease in 2012 was primarily due to the $1.3 billion acquisition of the Medicare prescription drug
business of Universal American Corp. (the “UAM Medicare Part D Business”) which occurred in April 2011.
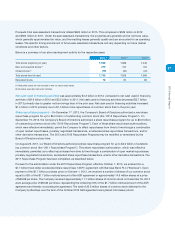
In 2013, gross capital expenditures totaled approximately $2.0 billion, a decrease of $46 million compared to the
prior year. During 2013, approximately 45% of our total capital expenditures were for new store construction, 25%
were for store, fulfillment and support facilities expansion and improvements and 30% were for technology and other
corporate initiatives. Gross capital expenditures totaled approximately $2.0 billion during 2012, compared to approxi-
mately $1.9 billion in 2011. The increase in gross capital expenditures during 2012 was primarily due to the increased
spending on store expansion and improvements. During 2012, approximately 45% of our total capital expenditures
were for new store construction, 40% were for store expansion and improvements and 15% were for technology and
other corporate initiatives.