CVS 2013 Annual Report Download - page 76
Download and view the complete annual report
Please find page 76 of the 2013 CVS annual report below. You can navigate through the pages in the report by either clicking on the pages listed below, or by using the keyword search tool below to find specific information within the annual report.-
 1
1 -
2
-
3
-
4
-
5
-
6
-
7
-
8
-
9
-
10
-
11
-
12
-
13
-
14
-
15
-
16
-
17
-
18
-
19
-
20
-
21
-
22
-
23
-
24
-
25
-
26
-
27
-
28
-
29
-
30
-
31
-
32
-
33
-
34
-
35
-
36
-
37
-
38
-
39
-
40
-
41
-
42
-
43
-
44
-
45
-
46
-
47
-
48
-
49
-
50
-
51
-
52
-
53
-
54
-
55
-
56
-
57
-
58
-
59
-
60
-
61
-
62
-
63
-
64
-
65
-
 66
66 -
 67
67 -
 68
68 -
 69
69 -
 70
70 -
 71
71 -
 72
72 -
 73
73 -
 74
74 -
 75
75 -
 76
76 -
 77
77 -
 78
78 -
 79
79 -
 80
80 -
 81
81 -
 82
82 -
 83
83 -
 84
84 -
 85
85 -
 86
86 -
87
-
88
-
89
-
90
-
91
-
92
-
93
-
94
-
95
-
96
 |
 |

74
CVS Caremark
Notes to Consolidated Financial Statements
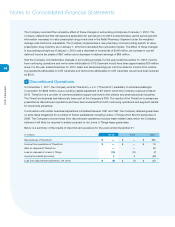
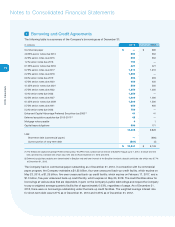
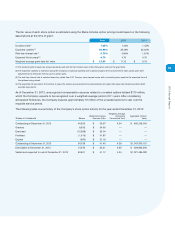
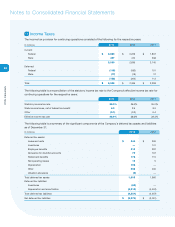
7 Leases
The Company leases most of its retail and mail order locations, ten of its distribution centers and certain corporate
offices under noncancelable operating leases, typically with initial terms of 15 to 25 years and with options that
permit renewals for additional periods. The Company also leases certain equipment and other assets under noncan-
celable operating leases, typically with initial terms of 3 to 10 years. Minimum rent is expensed on a straight-line basis
over the term of the lease. In addition to minimum rental payments, certain leases require additional payments based
on sales volume, as well as reimbursement for real estate taxes, common area maintenance and insurance, which are
expensed when incurred.
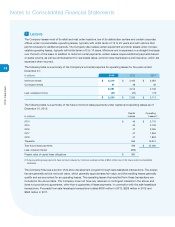
The following table is a summary of the Company’s net rental expense for operating leases for the years ended
December 31:
In millions
2013 2012 2011
Minimum rentals
$ 2,210
$ 2,165 $ 2,087
Contingent rentals
41
48 49
2,251
2,213 2,136
Less: sublease income
(21)
(20) (19)
$ 2,230
$ 2,193 $ 2,117
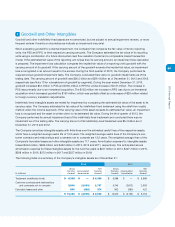
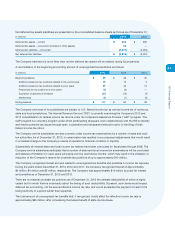
The following table is a summary of the future minimum lease payments under capital and operating leases as of
December 31, 2013:
Capital Operating
In millions
Leases Leases (1)
2014 $ 46 $ 2,175
2015 46 2,129
2016 47 2,055
2017 47 1,964
2018 47 1,853
Thereafter 556 16,914
Total future lease payments 789 $ 27,090
Less: imputed interest (399)
Present value of capital lease obligations $ 390
(1) Future operating lease payments have not been reduced by minimum sublease rentals of $224 million due in the future under noncancelable
subleases.
The Company finances a portion of its store development program through sale-leaseback transactions. The proper-
ties are generally sold at net book value, which generally approximates fair value, and the resulting leases generally
qualify and are accounted for as operating leases. The operating leases that resulted from these transactions are
included in the above table. The Company does not have any retained or contingent interests in the stores and
does not provide any guarantees, other than a guarantee of lease payments, in connection with the sale-leaseback
transactions. Proceeds from sale-leaseback transactions totaled $600 million in 2013, $529 million in 2012 and
$592 million in 2011.