CVS 2013 Annual Report Download - page 36
Download and view the complete annual report
Please find page 36 of the 2013 CVS annual report below. You can navigate through the pages in the report by either clicking on the pages listed below, or by using the keyword search tool below to find specific information within the annual report.-
 1
1 -
2
-
3
-
4
-
5
-
6
-
7
-
8
-
9
-
10
-
11
-
12
-
13
-
14
-
15
-
16
-
17
-
18
-
19
-
20
-
21
-
22
-
23
-
24
-
25
-
 26
26 -
 27
27 -
 28
28 -
 29
29 -
 30
30 -
 31
31 -
 32
32 -
 33
33 -
 34
34 -
 35
35 -
 36
36 -
 37
37 -
 38
38 -
 39
39 -
 40
40 -
 41
41 -
 42
42 -
 43
43 -
 44
44 -
 45
45 -
 46
46 -
47
-
48
-
49
-
50
-
51
-
52
-
53
-
54
-
55
-
56
-
57
-
58
-
59
-
60
-
61
-
62
-
63
-
64
-
65
-
66
-
67
-
68
-
69
-
70
-
71
-
72
-
73
-
74
-
75
-
76
-
77
-
78
-
79
-
80
-
81
-
82
-
83
-
84
-
85
-
86
-
87
-
88
-
89
-
90
-
91
-
92
-
93
-
94
-
95
-
96
 |
 |

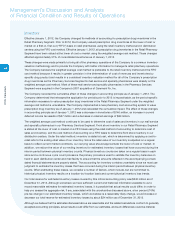
Management’s Discussion and Analysis
of Financial Condition and Results of Operations
34
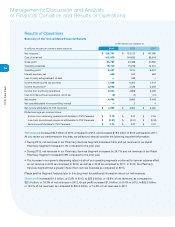
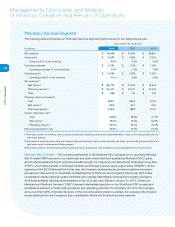
CVS Caremark
Net revenues
increased approximately $2.0 billion, or 3.1%, to $65.6 billion for the year ended December 31, 2013,
as compared to the prior year. This increase was primarily driven by a same store sales increase of 1.7% and net
revenues from new and acquired stores, which accounted for approximately 130 basis points of our total net revenue
percentage increase during the year. Additionally, we continued to see a positive impact on our net revenues due to
the growth of our Maintenance Choice program.
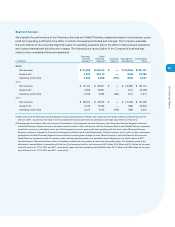
Net revenues in our Retail Pharmacy Segment increased $4.1 billion, or 6.8% to $63.6 billion for the year ended
December 31, 2012, as compared to the prior year. This increase was primarily driven by a same store sales increase
of 5.6% and net revenues from new stores, which accounted for approximately 110 basis points of our total net
revenue percentage increase during the year. Additionally, we continued to see a positive impact on our net revenues
due to the growth of our Maintenance Choice program.
As you review our Retail Pharmacy Segment’s performance in this area, we believe you should consider the following
important information:
• Front store same store sales declined 0.5% in the year ended December 31, 2013, as compared to the prior year.
2013 had one less day as a result of 2012 being a leap year, which had a negative impact on front store same store
sales of approximately 40 basis points. Front store same store sales were negatively impacted by a decrease in
customer traffic, partially offset by an increase in basket size.
• Pharmacy same store sales rose 2.6% in the year ended December 31, 2013, as compared to the prior year.
Pharmacy same store sales were positively impacted by increased prescription volume, partially offset by the
negative impact of the increase in generic dispensing, reimbursement pressure, and the impact of 2013 having
one fewer day as a result of 2012 being a leap year.
• Pharmacy revenues continue to be negatively impacted by the conversion of brand name drugs to equivalent
generic drugs, which typically have a lower selling price. Pharmacy same store sales were negatively impacted by
approximately 540 and 700 basis points for the years ended December 31, 2013 and 2012, respectively, due to
recent generic introductions. The decrease in the impact from 2012 to 2013 was primarily due to a smaller impact
from new generic drug introductions. In addition, our pharmacy growth has also been adversely affected by the
lack of significant new brand name drug introductions, higher consumer co-payments and co-insurance arrange-
ments and an increase in the number of over-the-counter remedies that were historically only available by
prescription.
• As of December 31, 2013, we operated 7,660 retail stores compared to 7,458 retail stores as of December 31, 2012
and 7,327 retail stores as of December 31, 2011. Total net revenues from new stores (excluding acquired stores)
contributed approximately 1.0%, 1.1% and 1.3% to our total net revenue percentage increase in 2013, 2012, and
2011, respectively.
• Pharmacy revenue growth continued to benefit from increased utilization by Medicare Part D beneficiaries, the
ability to attract and retain managed care customers and favorable industry trends. These trends include an aging
American population; many “baby boomers” are now in their fifties and sixties and are consuming a greater number
of prescription drugs. In addition, the increased use of pharmaceuticals as the first line of defense for individual
health care also contributed to the growing demand for pharmacy services. We believe these favorable industry
trends will continue.
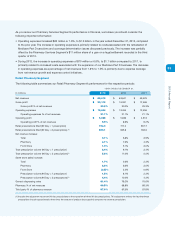
Gross profit
in our Retail Pharmacy Segment includes net revenues less the cost of merchandise sold during the
reporting period and the related purchasing costs, warehousing costs, delivery costs and actual and estimated
inventory losses.