CVS 2013 Annual Report Download - page 35
Download and view the complete annual report
Please find page 35 of the 2013 CVS annual report below. You can navigate through the pages in the report by either clicking on the pages listed below, or by using the keyword search tool below to find specific information within the annual report.-
 1
1 -
2
-
3
-
4
-
5
-
6
-
7
-
8
-
9
-
10
-
11
-
12
-
13
-
14
-
15
-
16
-
17
-
18
-
19
-
20
-
21
-
22
-
23
-
24
-
 25
25 -
 26
26 -
 27
27 -
 28
28 -
 29
29 -
 30
30 -
 31
31 -
 32
32 -
 33
33 -
 34
34 -
 35
35 -
 36
36 -
 37
37 -
 38
38 -
 39
39 -
 40
40 -
 41
41 -
 42
42 -
 43
43 -
 44
44 -
 45
45 -
46
-
47
-
48
-
49
-
50
-
51
-
52
-
53
-
54
-
55
-
56
-
57
-
58
-
59
-
60
-
61
-
62
-
63
-
64
-
65
-
66
-
67
-
68
-
69
-
70
-
71
-
72
-
73
-
74
-
75
-
76
-
77
-
78
-
79
-
80
-
81
-
82
-
83
-
84
-
85
-
86
-
87
-
88
-
89
-
90
-
91
-
92
-
93
-
94
-
95
-
96
 |
 |
33
2013 Annual Report
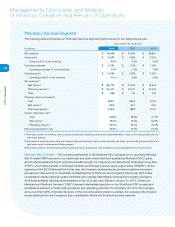
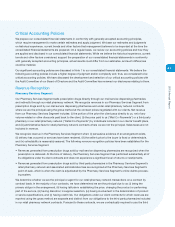
As you review our Pharmacy Services Segment’s performance in this area, we believe you should consider the
following important information:
• Operating expenses increased $22 million or 1.9%, to $1.2 billion, in the year ended December 31, 2013, compared
to the prior year. The increase in operating expenses is primarily related to costs associated with the remediation of
Medicare Part D sanctions and coverage determination issues discussed previously. The increase was partially
offset by the Pharmacy Services Segment’s $11 million share of a gain on a legal settlement recorded in the third
quarter of 2013.
• During 2012, the increase in operating expenses of $70 million or 6.6%, to $1.1 billion compared to 2011, is
primarily related to increased costs associated with the expansion of our Medicare Part D business. The decrease
in operating expenses as a percentage of net revenues from 1.8% to 1.5% is primarily due to expense leverage
from net revenue growth and expense control initiatives.
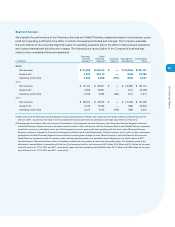
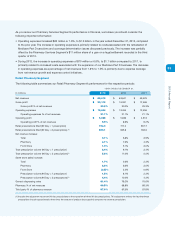
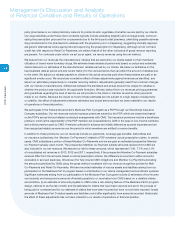
Retail Pharmacy Segment
The following table summarizes our Retail Pharmacy Segment’s performance for the respective periods:
YEAR ENDED DECEMBER 31,
In millions
2013 2012 2011
Net revenues
$ 65,618
$ 63,641 $ 59,579
Gross profit
$ 20,112
$ 19,091 $ 17,469
Gross profit % of net revenues
30.6 %
30.0 % 29.3 %
Operating expenses
$ 13,844
$ 13,455 $ 12,556
Operating expenses % of net revenues
21.1 %
21.1 % 21.1 %
Operating profit
$ 6,268
$ 5,636 $ 4,913
Operating profit % of net revenues
9.6 %
8.9 % 8.2 %
Retail prescriptions filled (90 Day = 1 prescription)
734.3
717.4 657.7
Retail prescriptions filled (90 Day = 3 prescriptions) (1)
890.1
845.8 763.6
Net revenue increase:
Total
3.1 %
6.8 % 3.9 %
Pharmacy
4.1 %
7.6 % 4.3 %
Front Store
1.0 %
5.1 % 3.0 %
Total prescription volume (90 Day = 1 prescription)
2.4 %
9.1 % 3.4 %
Total prescription volume (90 Day = 3 prescriptions) (1)
5.2 %
11.0 % 5.5 %
Same store sales increase:
Total
1.7 %
5.6 % 2.3 %
Pharmacy
2.6 %
6.6 % 3.0 %
Front Store
(0.5)%
3.4 % 0.8 %
Prescription volume (90 Day = 1 prescription)
1.5 %
8.1 % 2.3 %
Prescription volume (90 Day = 3 prescriptions) (1)
4.4 %
10.0 % 4.3 %
Generic dispensing rates
81.4 %
79.2 % 75.6 %
Pharmacy % of net revenues
69.5 %
68.8 % 68.3 %
Third party % of pharmacy revenue
97.9 %
97.5 % 97.8 %
(1) Includes the adjustment to convert 90-day prescriptions to the equivalent of three 30-day prescriptions. This adjustment reflects the fact that these
prescriptions include approximately three times the amount of product days supplied compared to a normal prescription.