CVS 2013 Annual Report Download - page 33
Download and view the complete annual report
Please find page 33 of the 2013 CVS annual report below. You can navigate through the pages in the report by either clicking on the pages listed below, or by using the keyword search tool below to find specific information within the annual report.-
 1
1 -
2
-
3
-
4
-
5
-
6
-
7
-
8
-
9
-
10
-
11
-
12
-
13
-
14
-
15
-
16
-
17
-
18
-
19
-
20
-
21
-
22
-
 23
23 -
 24
24 -
 25
25 -
 26
26 -
 27
27 -
 28
28 -
 29
29 -
 30
30 -
 31
31 -
 32
32 -
 33
33 -
 34
34 -
 35
35 -
 36
36 -
 37
37 -
 38
38 -
 39
39 -
 40
40 -
 41
41 -
 42
42 -
 43
43 -
44
-
45
-
46
-
47
-
48
-
49
-
50
-
51
-
52
-
53
-
54
-
55
-
56
-
57
-
58
-
59
-
60
-
61
-
62
-
63
-
64
-
65
-
66
-
67
-
68
-
69
-
70
-
71
-
72
-
73
-
74
-
75
-
76
-
77
-
78
-
79
-
80
-
81
-
82
-
83
-
84
-
85
-
86
-
87
-
88
-
89
-
90
-
91
-
92
-
93
-
94
-
95
-
96
 |
 |

31
2013 Annual Report
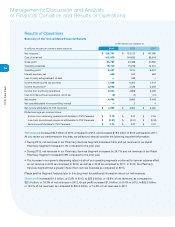
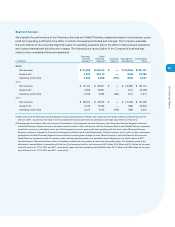
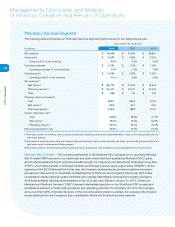
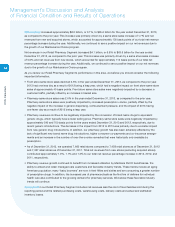
Net revenues
in our Pharmacy Services Segment increased $2.8 billion, or 3.8%, to $76.2 billion for the year ended
December 31, 2013, as compared to the prior year. The increase in net revenues was primarily due to drug cost
inflation in the specialty pharmacy business. Conversely, the increase in our generic dispensing rate had a negative
impact on our revenue in 2013, as it did in 2012.
Net revenues increased $14.6 billion, or 24.7%, to $73.4 billion for the year ended December 31, 2012, as compared
to the prior year. The increase in 2012 was primarily due to new client starts on January 1, 2012, drug cost inflation
and the growth of our Medicare Part D business. Additionally, the increase in our generic dispensing rate had a
negative impact on our revenue in 2012 as it did in 2011.
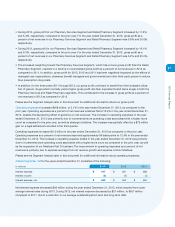
As you review our Pharmacy Services Segment’s revenue performance, we believe you should also consider the
following important information:
• Our mail choice claims processed increased 1.9% to 83.3 million claims in the year ended December 31, 2013,
compared to 81.7 million claims in the prior year. The increase in mail choice claim volume was primarily due to
increased claims associated with the continuing client adoption of our Maintenance Choice offerings. During 2012,
our mail choice claims processed increased 15.7% to 81.7 million claims. The increase in mail choice claim volume
was primarily due to a significant number of 2012 new client starts, as well as increased claims associated with the
continued adoption of our Maintenance Choice offerings.
• During 2013 and 2012, our average revenue per mail choice claim increased by 6.5% and 6.0%, compared to 2012
and 2011, respectively. This increase was primarily due to drug cost inflation particularly in our specialty business,
partially offset by increases in the percentage of generic prescription drugs dispensed and changes in client pricing.
• Our mail choice generic dispensing rate was 76.0%, 72.0% and 64.9% in the years ended December 31, 2013,
2012 and 2011, respectively.
• Our pharmacy network generic dispensing rate increased to 81.3% in the year ended December 31, 2013, com-
pared to 79.1% in the prior year. During 2012, our pharmacy network generic dispensing rate increased to 79.1%
compared to our pharmacy network generic dispensing rate of 75.0% in 2011. These continued increases in both
mail choice and pharmacy network generic dispensing rates were primarily due to the impact of new generic drug
introductions, primarily in 2012, and our continuous efforts to encourage plan members to use generic drugs when
they are available. We believe our generic dispensing rates will continue to increase in future periods, albeit, at a
slower pace. This increase will be affected by, among other things, the number of new generic drug introductions
and our success at encouraging plan members to utilize generic drugs when they are available and clinically
appropriate.
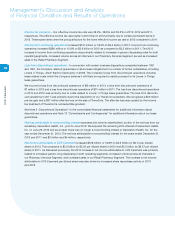
• Our pharmacy network claims processed increased 2.5% to 818.8 million claims in the year ended December 31,
2013, compared to 798.8 million claims in the prior year. During 2012, our pharmacy network claims processed
increased 13.5% to 798.8 million compared to 704.0 million pharmacy network claims processed in 2011. The
increase in the pharmacy network claim volume was primarily due to higher claims activity associated with our
Medicare Part D program.
• Our average revenue per pharmacy network claim processed decreased 0.9% in the year ended December 31,
2013 as compared to the prior year. This decrease was primarily due to increases in the generic dispensing rate.
During 2012, our average revenue per pharmacy network claim processed increased by 11.0%, compared to 2011.
This increase was primarily due to drug cost inflation partially offset by increases in the generic dispensing rate.
• The Pharmacy Services Segment recognizes revenues for its pharmacy network transactions based on individual
contract terms. In accordance with ASC 605,
Revenue Recognition
, CVS Caremark Pharmacy Services’ contracts
are predominantly accounted for using the gross method.