CVS 2013 Annual Report Download - page 20
Download and view the complete annual report
Please find page 20 of the 2013 CVS annual report below. You can navigate through the pages in the report by either clicking on the pages listed below, or by using the keyword search tool below to find specific information within the annual report.-
 1
1 -
2
-
3
-
4
-
5
-
6
-
7
-
8
-
9
-
 10
10 -
 11
11 -
 12
12 -
 13
13 -
 14
14 -
 15
15 -
 16
16 -
 17
17 -
 18
18 -
 19
19 -
 20
20 -
 21
21 -
 22
22 -
 23
23 -
 24
24 -
 25
25 -
 26
26 -
 27
27 -
 28
28 -
 29
29 -
 30
30 -
31
-
32
-
33
-
34
-
35
-
36
-
37
-
38
-
39
-
40
-
41
-
42
-
43
-
44
-
45
-
46
-
47
-
48
-
49
-
50
-
51
-
52
-
53
-
54
-
55
-
56
-
57
-
58
-
59
-
60
-
61
-
62
-
63
-
64
-
65
-
66
-
67
-
68
-
69
-
70
-
71
-
72
-
73
-
74
-
75
-
76
-
77
-
78
-
79
-
80
-
81
-
82
-
83
-
84
-
85
-
86
-
87
-
88
-
89
-
90
-
91
-
92
-
93
-
94
-
95
-
96
 |
 |

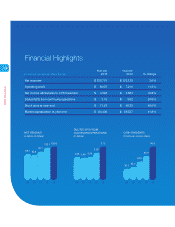
18
CVS Caremark
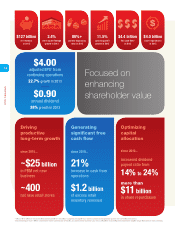
Focused on
enhancing
shareholder value
$127 billion
net revenues
in 2013
$4.00
adjusted EPS
†
from
continuing operations
22.7%
growth in 2013
–
$0.90
annual dividend
38%
growth in 2013
$4.0 billion
share repurchases
in 2013
11.5%
operating profit
growth in 2013
$4.4 billion
free cash flow*
in 2013
80%+
generic dispensing
rates in 2013
2.4%
store square footage
growth in 2013
$
Driving
productive
long-term growth
since 2010...
~$25 billion
in PBM net new
business
~400
net new retail stores
Generating
significant free
cash flow
since 2010...
21%
increase in cash from
operations
$1.2 billion
of excess retail
inventory removed
Optimizing
capital
allocation
since 2010...
increased dividend
payout ratio from
14% to 24%
more than
$11 billion
in share repurchases
* Free cash flow is defined as net cash provided by operating activities less net additions to properties and equipment (i.e., additions to property and equipment plus proceeds from sale-leaseback transactions).
† Adjusted earnings per share is defined as income before income tax provision plus amortization, less adjusted income tax provision, plus net loss attributable to noncontrolling interest divided by the weighted average diluted common shares outstanding.