CVS 2013 Annual Report Download - page 37
Download and view the complete annual report
Please find page 37 of the 2013 CVS annual report below. You can navigate through the pages in the report by either clicking on the pages listed below, or by using the keyword search tool below to find specific information within the annual report.-
 1
1 -
2
-
3
-
4
-
5
-
6
-
7
-
8
-
9
-
10
-
11
-
12
-
13
-
14
-
15
-
16
-
17
-
18
-
19
-
20
-
21
-
22
-
23
-
24
-
25
-
26
-
 27
27 -
 28
28 -
 29
29 -
 30
30 -
 31
31 -
 32
32 -
 33
33 -
 34
34 -
 35
35 -
 36
36 -
 37
37 -
 38
38 -
 39
39 -
 40
40 -
 41
41 -
 42
42 -
 43
43 -
 44
44 -
 45
45 -
 46
46 -
 47
47 -
48
-
49
-
50
-
51
-
52
-
53
-
54
-
55
-
56
-
57
-
58
-
59
-
60
-
61
-
62
-
63
-
64
-
65
-
66
-
67
-
68
-
69
-
70
-
71
-
72
-
73
-
74
-
75
-
76
-
77
-
78
-
79
-
80
-
81
-
82
-
83
-
84
-
85
-
86
-
87
-
88
-
89
-
90
-
91
-
92
-
93
-
94
-
95
-
96
 |
 |

35
2013 Annual Report
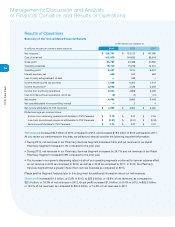
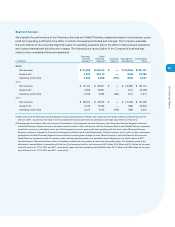
Gross profit increased $1.0 billion, or 5.3%, to $20.1 billion in the year ended December 31, 2013, as compared to
the prior year. Gross profit as a percentage of net revenues increased to 30.6% in year ended December 31, 2013,
from 30.0% in 2012. The increase in gross profit dollars in the year ended December 31, 2013, was primarily driven
by increases in the generic dispensing rate, same store sales and new store sales. The increase in gross profit as
a percentage of net revenues was primarily driven by increased pharmacy margins due to the positive impact of
increased generic dispensing rates and increased front store margins, partially offset by continued reimbursement
pressure.
Gross profit increased $1.6 billion, or 9.3%, to $19.1 billion for the year ended December 31, 2012, as compared
to the prior year. Gross profit as a percentage of net revenues increased to 30.0% for the year ended December 31,
2012, compared to 29.3% for the prior year. The increase in gross profit dollars in the year ended December 31,
2012, was primarily driven by same store sales increases. The increase in gross profit as a percentage of revenue
was primarily driven by increased pharmacy margins due to the positive impact of increased generic drugs dispensed,
partially offset by continued reimbursement pressure and lower front store margins.
As you review our Retail Pharmacy Segment’s performance in this area, we believe you should consider the following
important information:
• Gross profit was positively impacted by approximately $31 million for the year ended December 31, 2012 as a
result of the change in inventory accounting methods described in Note 2 to our consolidated financial statements.
The impact of this change on gross profit as a percentage of net revenues for the year ended December 31, 2012
was approximately five basis points.
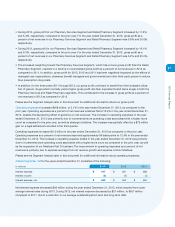
• On average, our gross profit on front store revenues is generally higher than our gross profit on pharmacy
revenues. Front store revenues were 30.5%, 31.2% and 31.7% of total revenues, in 2013, 2012 and 2011,
respectively. Pharmacy revenues were 69.5%, 68.8% and 68.3% of total revenues, in 2013, 2012 and 2011,
respectively. This shift in sales mix had a negative effect on our overall gross profit for the years ended
December 31, 2013, 2012 and 2011, respectively. The negative effect was offset by increasing generic drug
dispensing rates.
• Our pharmacy gross profit rates have been adversely affected by the efforts of managed care organizations,
pharmacy benefit managers and governmental and other third party payors to reduce their prescription drug costs.
In the event this trend continues, we may not be able to sustain our current rate of revenue growth and gross profit
dollars could be adversely impacted.
• The increased use of generic drugs has positively impacted our gross profit margins but has resulted in third party
payors augmenting their efforts to reduce reimbursement payments to retail pharmacies for prescriptions. This
trend, which we expect to continue, reduces the benefit we realize from brand to generic product conversions.
• Sales to customers covered by third party insurance programs are a large component of our total pharmacy
business. On average, our gross profit on third party pharmacy revenues is lower than our gross profit on cash
pharmacy revenues. Third party pharmacy revenues were 97.9% of pharmacy revenues in 2013, compared to
97.5% and 97.8% of pharmacy revenues in 2012 and 2011, respectively.
• The Patient Protection and Affordable Care Act and the Health Care and Education Reconciliation Act (collectively,
“ACA”) made several significant changes to Medicaid rebates and to reimbursement. One of these changes was
the proposed revision of the definition of Average Manufacturer Price (“AMP”) and the reimbursement formula for
multi-source drugs. Changes in reporting of AMP or other adjustments that may be made regarding the reimburse-
ment of drug payments by Medicaid and Medicare could impact our pricing to customers and other payors and/or
could impact our ability to negotiate discounts or rebates with manufacturers, wholesalers, PBMs or retail and mail
pharmacies. See “Government Regulation” within Part I, Item 1, Business, for additional information.