CVS 2013 Annual Report Download - page 79
Download and view the complete annual report
Please find page 79 of the 2013 CVS annual report below. You can navigate through the pages in the report by either clicking on the pages listed below, or by using the keyword search tool below to find specific information within the annual report.-
 1
1 -
2
-
3
-
4
-
5
-
6
-
7
-
8
-
9
-
10
-
11
-
12
-
13
-
14
-
15
-
16
-
17
-
18
-
19
-
20
-
21
-
22
-
23
-
24
-
25
-
26
-
27
-
28
-
29
-
30
-
31
-
32
-
33
-
34
-
35
-
36
-
37
-
38
-
39
-
40
-
41
-
42
-
43
-
44
-
45
-
46
-
47
-
48
-
49
-
50
-
51
-
52
-
53
-
54
-
55
-
56
-
57
-
58
-
59
-
60
-
61
-
62
-
63
-
64
-
65
-
66
-
67
-
68
-
 69
69 -
 70
70 -
 71
71 -
 72
72 -
 73
73 -
 74
74 -
 75
75 -
 76
76 -
 77
77 -
 78
78 -
 79
79 -
 80
80 -
 81
81 -
 82
82 -
 83
83 -
 84
84 -
 85
85 -
 86
86 -
 87
87 -
 88
88 -
 89
89 -
90
-
91
-
92
-
93
-
94
-
95
-
96
 |
 |

77
2013 Annual Report
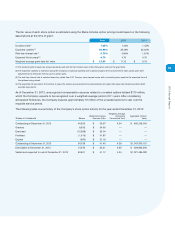
by one employer may be used to provide benefits to employees of other participating employers, (ii) if a participating
employer stops contributing to the plan, the unfunded obligations of the plan may be borne by the remaining partici-
pating employers, and (iii) if the Company chooses to stop participating in some of its multiemployer plans, the
Company may be required to pay those plans an amount based on the underfunded status of the plan, referred to
as a withdrawal liability.
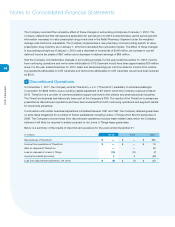
None of the multiemployer pension plans in which the Company participates are individually significant to the Company.
Total Company contributions to multiemployer pension plans were $13 million, $12 million and $11 million in 2013,
2012 and 2011, respectively.
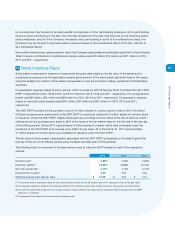
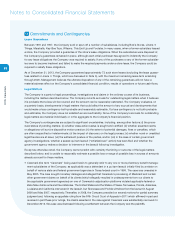
10 Stock Incentive Plans
Stock-based compensation expense is measured at the grant date based on the fair value of the award and is
recognized as expense over the applicable requisite service period of the stock award (generally three to five years)
using the straight-line method. Stock-based compensation costs are included in selling, general and administrative
expenses.
Compensation expense related to stock options, which includes the 2007 Employee Stock Purchase Plan (the “2007
ESPP”) totaled $100 million, $102 million and $112 million for 2013, 2012 and 2011, respectively. The recognized tax
benefit was $32 million, $33 million and $38 million for 2013, 2012 and 2011, respectively. Compensation expense
related to restricted stock awards totaled $41 million, $30 million and $21 million for 2013, 2012 and 2011,
respectively.
The 2007 ESPP provides for the purchase of up to 15 million shares of common stock. In March 2013, the Board
of Directors approved an amendment to the 2007 ESPP to provide an additional 15 million shares of common stock
for issuance. Under the 2007 ESPP, eligible employees may purchase common stock at the end of each six month
offering period at a purchase price equal to 85% of the lower of the fair market value on the first day or the last day
of the offering period. During 2013, approximately 2 million shares of common stock were purchased under the
provisions of the 2007 ESPP at an average price of $41.44 per share. As of December 31, 2013, approximately
17 million shares of common stock were available for issuance under the 2007 ESPP.
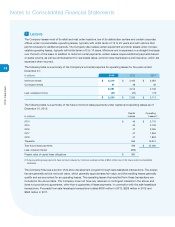
The fair value of stock-based compensation associated with the 2007 ESPP is estimated on the date of grant (the
first day of the six month offering period) using the Black-Scholes Option Pricing Model.
The following table is a summary of the assumptions used to value the ESPP awards for each of the respective
periods:
2013 2012 2011
Dividend yield (1)
0.86 %
0.73 % 0.69 %
Expected volatility (2)
16.94 %
22.88 % 20.42 %
Risk-free interest rate (3)
0.10 %
0.10 % 0.15 %
Expected life
(in years)
(4)
0.50
0.50 0.50
Weighted-average grant date fair value
$ 10.08
$ 9.22 $ 7.21
(1) The dividend yield is calculated based on semi-annual dividends paid and the fair market value of the Company’s stock at the grant date.
(2) The expected volatility is based on the historical volatility of the Company’s daily stock market prices over the previous six month period.
(3) The risk-free interest rate is based on the Treasury constant maturity interest rate whose term is consistent with the expected term of ESPP
options (i.e., 6 months).
(4) The expected life is based on the semi-annual purchase period.