CVS 2013 Annual Report Download - page 34
Download and view the complete annual report
Please find page 34 of the 2013 CVS annual report below. You can navigate through the pages in the report by either clicking on the pages listed below, or by using the keyword search tool below to find specific information within the annual report.-
 1
1 -
2
-
3
-
4
-
5
-
6
-
7
-
8
-
9
-
10
-
11
-
12
-
13
-
14
-
15
-
16
-
17
-
18
-
19
-
20
-
21
-
22
-
23
-
 24
24 -
 25
25 -
 26
26 -
 27
27 -
 28
28 -
 29
29 -
 30
30 -
 31
31 -
 32
32 -
 33
33 -
 34
34 -
 35
35 -
 36
36 -
 37
37 -
 38
38 -
 39
39 -
 40
40 -
 41
41 -
 42
42 -
 43
43 -
 44
44 -
45
-
46
-
47
-
48
-
49
-
50
-
51
-
52
-
53
-
54
-
55
-
56
-
57
-
58
-
59
-
60
-
61
-
62
-
63
-
64
-
65
-
66
-
67
-
68
-
69
-
70
-
71
-
72
-
73
-
74
-
75
-
76
-
77
-
78
-
79
-
80
-
81
-
82
-
83
-
84
-
85
-
86
-
87
-
88
-
89
-
90
-
91
-
92
-
93
-
94
-
95
-
96
 |
 |

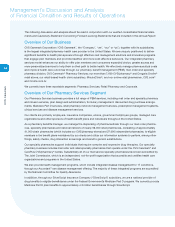
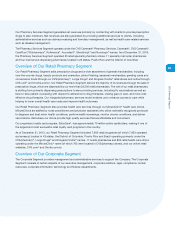
Management’s Discussion and Analysis
of Financial Condition and Results of Operations
32
CVS Caremark
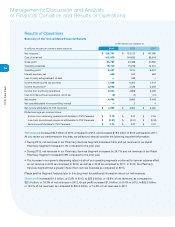
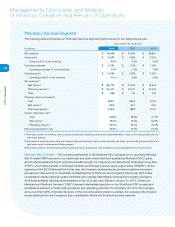
Gross profit
in our Pharmacy Services Segment includes net revenues less cost of revenues. Cost of revenues
includes (i) the cost of pharmaceuticals dispensed, either directly through our mail service and specialty retail
pharmacies or indirectly through our pharmacy network, (ii) shipping and handling costs and (iii) the operating costs
of our mail service dispensing pharmacies, customer service operations and related information technology support.
Gross profit increased $429 million, or 11.3% to $4.2 billion in the year ended December 31, 2013, as compared
to the prior year. Gross profit as a percentage of net revenues increased to 5.6% for the year ended December 31,
2013, compared to 5.2% in the prior year. The increase in gross profit dollars and gross profit as a percentage of
net revenues in the year ended December 31, 2013 was primarily due to an increase in generic dispensing.
During 2012, gross profit increased $529 million, or 16.1%, to $3.8 billion in the year ended December 31, 2012, as
compared to the prior year. Gross profit as a percentage of net revenues was 5.2% for the year ended December 31,
2012, compared to 5.6% in the prior year. The increase in gross profit dollars in the year ended December 31, 2012
was primarily due to a significant number of 2012 new client starts, an increase in generic dispensing and drug cost
inflation. The decrease in gross profit as a percentage of revenue was driven primarily by client pricing compression,
increased payroll and other expenses associated with our mail and specialty operations, and expanding Medicare
Part D operations, which has lower margins. The increase in expenses associated with our mail operations was the
result of the significant number of 2012 new client starts.
As you review our Pharmacy Services Segment’s performance in this area, we believe you should consider the
following important information:
• Our gross profit dollars and gross profit as a percentage of net revenues continued to be impacted by our efforts
to (i) retain existing clients, (ii) obtain new business and (iii) maintain or improve the rebates and/or discounts we
received from manufacturers, wholesalers and retail pharmacies. In particular, competitive pressures in the PBM
industry have caused us and other PBMs to continue to share a larger portion of rebates and/or discounts received
from pharmaceutical manufacturers with clients. In addition, market dynamics and regulatory changes have
impacted our ability to offer plan sponsors pricing that includes retail network “differential” or “spread”. We expect
these trends to continue. The “differential” or “spread” is any difference between the drug price charged to plan
sponsors, including Medicare Part D plan sponsors, by a PBM and the price paid for the drug by the PBM to the
dispensing provider. The increased use of generic drugs has positively impacted our gross profit margins but has
resulted in third party payors augmenting their efforts to reduce reimbursement payments for prescriptions. This
trend, which we expect to continue, reduces the benefit we realize from brand to generic product conversions.
• We review our network contracts on an individual basis to determine if the related revenues should be accounted
for using the gross method or net method under the applicable accounting rules. CVS Caremark Pharmacy
Services’ network contracts are predominantly accounted for using the gross method, which results in higher
revenues, higher cost of revenues and lower gross profit rates.
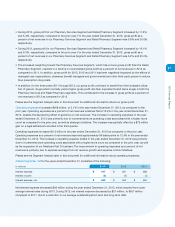
• Our gross profit as a percentage of revenues benefited from the increase in our total generic dispensing rate,
which increased to 80.8% and 78.5% in 2013 and 2012, respectively, compared to our generic dispensing rate of
74.1% in 2011. These increases were primarily due to new generic drug introductions and our continued efforts to
encourage plan members to use generic drugs when they are available. We expect these trends to continue, albeit
at a slower pace.
Operating expenses
in our Pharmacy Services Segment, which include selling, general and administrative expenses,
depreciation and amortization related to selling, general and administrative activities and retail specialty pharmacy
store and administrative payroll, employee benefits and occupancy costs, remained flat at 1.5% of net revenues in
2013 compared to 1.5% in 2012, and decreased from 1.8% in 2011.