CVS 2013 Annual Report Download - page 42
Download and view the complete annual report
Please find page 42 of the 2013 CVS annual report below. You can navigate through the pages in the report by either clicking on the pages listed below, or by using the keyword search tool below to find specific information within the annual report.-
 1
1 -
2
-
3
-
4
-
5
-
6
-
7
-
8
-
9
-
10
-
11
-
12
-
13
-
14
-
15
-
16
-
17
-
18
-
19
-
20
-
21
-
22
-
23
-
24
-
25
-
26
-
27
-
28
-
29
-
30
-
31
-
 32
32 -
 33
33 -
 34
34 -
 35
35 -
 36
36 -
 37
37 -
 38
38 -
 39
39 -
 40
40 -
 41
41 -
 42
42 -
 43
43 -
 44
44 -
 45
45 -
 46
46 -
 47
47 -
 48
48 -
 49
49 -
 50
50 -
 51
51 -
 52
52 -
53
-
54
-
55
-
56
-
57
-
58
-
59
-
60
-
61
-
62
-
63
-
64
-
65
-
66
-
67
-
68
-
69
-
70
-
71
-
72
-
73
-
74
-
75
-
76
-
77
-
78
-
79
-
80
-
81
-
82
-
83
-
84
-
85
-
86
-
87
-
88
-
89
-
90
-
91
-
92
-
93
-
94
-
95
-
96
 |
 |
Management’s Discussion and Analysis
of Financial Condition and Results of Operations
40
CVS Caremark
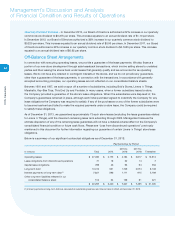
Quarterly Dividend Increase –
In December 2013, our Board of Directors authorized a 22% increase in our quarterly
common stock dividend to $0.275 per share. This increase equates to an annual dividend rate of $1.10 per share.
In December 2012, our Board of Directors authorized a 38% increase in our quarterly common stock dividend to
$0.225 per share. This increase equated to an annual dividend rate of $0.90 per share. In December 2011, our Board
of Directors authorized a 30% increase in our quarterly common stock dividend to $0.1625 per share. This increase
equated to an annual dividend rate of $0.65 per share.
O-Balance Sheet Arrangements
In connection with executing operating leases, we provide a guarantee of the lease payments. We also finance a
portion of our new store development through sale-leaseback transactions, which involve selling stores to unrelated
parties and then leasing the stores back under leases that generally qualify and are accounted for as operating
leases. We do not have any retained or contingent interests in the stores, and we do not provide any guarantees,
other than a guarantee of the lease payments, in connection with the transactions. In accordance with generally
accepted accounting principles, our operating leases are not reflected on our consolidated balance sheets.
Between 1991 and 1997, we sold or spun off a number of subsidiaries, including Bob’s Stores, Linens ‘n Things,
Marshalls, Kay-Bee Toys, This End Up and Footstar. In many cases, when a former subsidiary leased a store,
the Company provided a guarantee of the store’s lease obligations. When the subsidiaries were disposed of, the
Company’s guarantees remained in place, although each initial purchaser agreed to indemnify the Company for any
lease obligations the Company was required to satisfy. If any of the purchasers or any of the former subsidiaries were
to become insolvent and failed to make the required payments under a store lease, the Company could be required
to satisfy these obligations.
As of December 31, 2013, we guaranteed approximately 73 such store leases (excluding the lease guarantees related
to Linens ‘n Things), with the maximum remaining lease term extending through 2026. Management believes the
ultimate disposition of any of the remaining lease guarantees will not have a material adverse effect on the Company’s
consolidated financial condition or future cash flows. Please see “Loss from discontinued operations” previously
mentioned in this document for further information regarding our guarantee of certain Linens ‘n Things’ store lease
obligations.
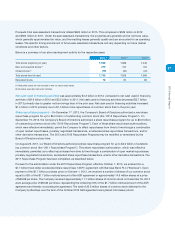
Below is a summary of our significant contractual obligations as of December 31, 2013:
Payments Due by Period
2015 to 2017 to
In millions
Total 2014 2016 2018 Thereafter
Operating leases $ 27,090 $ 2,175 $ 4,184 $ 3,817 $ 16,914
Lease obligations from discontinued operations 71 18 32 14 7
Capital lease obligations 789 46 93 94 556
Long-term debt 13,012 551 1,749 2,574 8,138
Interest payments on long-term debt (1) 7,821 596 1,111 915 5,199
Other long-term liabilities reflected in our
consolidated balance sheet 514 54 158 81 221
$ 49,297 $ 3,440 $ 7,327 $ 7,495 $ 31,035
(1) Interest payments on long-term debt are calculated on outstanding balances and interest rates in effect on December 31, 2013.