CVS 2013 Annual Report Download - page 81
Download and view the complete annual report
Please find page 81 of the 2013 CVS annual report below. You can navigate through the pages in the report by either clicking on the pages listed below, or by using the keyword search tool below to find specific information within the annual report.-
 1
1 -
2
-
3
-
4
-
5
-
6
-
7
-
8
-
9
-
10
-
11
-
12
-
13
-
14
-
15
-
16
-
17
-
18
-
19
-
20
-
21
-
22
-
23
-
24
-
25
-
26
-
27
-
28
-
29
-
30
-
31
-
32
-
33
-
34
-
35
-
36
-
37
-
38
-
39
-
40
-
41
-
42
-
43
-
44
-
45
-
46
-
47
-
48
-
49
-
50
-
51
-
52
-
53
-
54
-
55
-
56
-
57
-
58
-
59
-
60
-
61
-
62
-
63
-
64
-
65
-
66
-
67
-
68
-
69
-
70
-
 71
71 -
 72
72 -
 73
73 -
 74
74 -
 75
75 -
 76
76 -
 77
77 -
 78
78 -
 79
79 -
 80
80 -
 81
81 -
 82
82 -
 83
83 -
 84
84 -
 85
85 -
 86
86 -
 87
87 -
 88
88 -
 89
89 -
 90
90 -
 91
91 -
92
-
93
-
94
-
95
-
96
 |
 |

79
2013 Annual Report
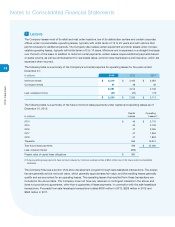
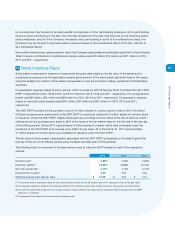
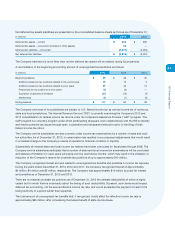
The fair value of each stock option is estimated using the Black-Scholes option pricing model based on the following
assumptions at the time of grant:
2013 2012 2011
Dividend yield (1)
1.65 %
1.44 % 1.43 %
Expected volatility (2)
30.96 %
32.49 % 32.62 %
Risk-free interest rate (3)
0.73 %
0.84 % 1.81 %
Expected life
(in years)
(4)
4.70
4.70 4.70
Weighted-average grant date fair value
$ 12.50
$ 11.12 $ 9.19
(1) The dividend yield is based on annual dividends paid and the fair market value of the Company’s stock at the grant date.
(2) The expected volatility is estimated using the Company’s historical volatility over a period equal to the expected life of each option grant after
adjustments for infrequent events such as stock splits.
(3) The risk-free interest rate is selected based on yields from U.S. Treasury zero-coupon issues with a remaining term equal to the expected term of
the options being valued.
(4) The expected life represents the number of years the options are expected to be outstanding from grant date based on historical option holder
exercise experience.
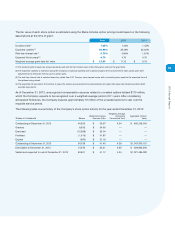
As of December 31, 2013, unrecognized compensation expense related to unvested options totaled $170 million,
which the Company expects to be recognized over a weighted-average period of 2.1 years. After considering
anticipated forfeitures, the Company expects approximately 19 million of the unvested options to vest over the
requisite service period.
The following table is a summary of the Company’s stock option activity for the year ended December 31, 2013:
Weighted Average
Weighted Average Remaining Aggregate Intrinsic
Shares in thousands
Shares Exercise Price Contractual Term Value
Outstanding at December 31, 2012 40,929 $ 36.57 4.34 $ 482,249,000
Granted 8,556 $ 54.60 — —
Exercised (12,568) $ 35.04 — —
Forfeited (1,619) $ 41.87 — —
Expired (560) $ 31.18 — —
Outstanding at December 31, 2013 34,738 $ 41.40 4.39 $ 1,047,976,191
Exercisable at December 31, 2013 14,573 $ 35.21 2.95 $ 529,832,395
Vested and expected to vest at December 31, 2013 33,601 $ 41.17 4.34 $ 1,021,486,782