CVS 2013 Annual Report Download - page 88
Download and view the complete annual report
Please find page 88 of the 2013 CVS annual report below. You can navigate through the pages in the report by either clicking on the pages listed below, or by using the keyword search tool below to find specific information within the annual report.-
 1
1 -
2
-
3
-
4
-
5
-
6
-
7
-
8
-
9
-
10
-
11
-
12
-
13
-
14
-
15
-
16
-
17
-
18
-
19
-
20
-
21
-
22
-
23
-
24
-
25
-
26
-
27
-
28
-
29
-
30
-
31
-
32
-
33
-
34
-
35
-
36
-
37
-
38
-
39
-
40
-
41
-
42
-
43
-
44
-
45
-
46
-
47
-
48
-
49
-
50
-
51
-
52
-
53
-
54
-
55
-
56
-
57
-
58
-
59
-
60
-
61
-
62
-
63
-
64
-
65
-
66
-
67
-
68
-
69
-
70
-
71
-
72
-
73
-
74
-
75
-
76
-
77
-
 78
78 -
 79
79 -
 80
80 -
 81
81 -
 82
82 -
 83
83 -
 84
84 -
 85
85 -
 86
86 -
 87
87 -
 88
88 -
 89
89 -
 90
90 -
 91
91 -
 92
92 -
 93
93 -
 94
94 -
 95
95 -
 96
96
 |
 |

86
CVS Caremark
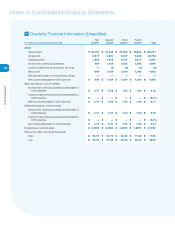
Notes to Consolidated Financial Statements
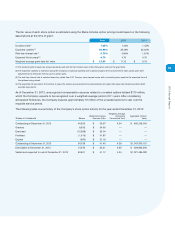
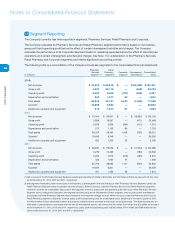
13 Segment Reporting
The Company currently has three reportable segments: Pharmacy Services, Retail Pharmacy and Corporate.
The Company evaluates its Pharmacy Services and Retail Pharmacy segment performance based on net revenue,
gross profit and operating profit before the effect of certain intersegment activities and charges. The Company
evaluates the performance of its Corporate Segment based on operating expenses before the effect of discontinued
operations and certain intersegment activities and charges. See Note 1 for a description of the Pharmacy Services,
Retail Pharmacy and Corporate segments and related significant accounting policies.
The following table is a reconciliation of the Company’s business segments to the consolidated financial statements:
Pharmacy Retail
Services Pharmacy Corporate Intersegment Consolidated
In millions
Segment (1) (2) Segment (2) Segment Eliminations (2) Totals
2013:
Net revenues
$
76,208 $ 65,618 $ — $ (15,065) $ 126,761
Gross profit
4,237 20,112 — (566) 23,783
Operating profit
3,086 6,268 (751) (566) 8,037
Depreciation and amortization
560 1,217 93 — 1,870
Total assets
38,343 30,191 4,420 (1,428) 71,526
Goodwill
19,658 6,884 — — 26,542
Additions to property and equipment
313 1,610 61 — 1,984
2012:
Net revenues $ 73,444 $ 63,641 $ — $ (13,965) $ 123,120
Gross profit 3,808 19,091 — (411) 22,488
Operating profit 2,679 5,636 (694) (411) 7,210
Depreciation and amortization 517 1,153 83 — 1,753
Total assets 36,057 29,492 1,408 (736) 66,221
Goodwill 19,646 6,749 — — 26,395
Additions to property and equipment 422 1,555 53 — 2,030
2011:
Net revenues $ 58,874 $ 59,579 $ — $ (11,373) $ 107,080
Gross profit 3,279 17,469 — (186) 20,562
Operating profit 2,220 4,913 (616) (186) 6,331
Depreciation and amortization 433 1,060 75 — 1,568
Total assets 35,704 28,632 1,121 (605) 64,852
Goodwill 19,657 6,801 — — 26,458
Additions to property and equipment 461 1,353 58 — 1,872
(1) Net revenues of the Pharmacy Services Segment include approximately $7.9 billion, $8.4 billion and $7.9 billion of Retail co-payments for the years
ended December 31, 2013, 2012 and 2011, respectively.
(2) Intersegment eliminations relate to two types of transactions: (i) Intersegment revenues that occur when Pharmacy Services Segment clients use
Retail Pharmacy Segment stores to purchase covered products. When this occurs, both the Pharmacy Services and Retail Pharmacy segments
record the revenue on a standalone basis and (ii) Intersegment revenues, gross profit and operating profit that occur when Pharmacy Services
Segment clients, through the Company’s intersegment activities (such as the Maintenance Choice program), elect to pick up their maintenance
prescriptions at Retail Pharmacy Segment stores instead of receiving them through the mail. When this occurs, both the Pharmacy Services and
Retail Pharmacy segments record the revenue, gross profit and operating profit on a standalone basis. Beginning in the fourth quarter of 2011,
the Maintenance Choice eliminations reflect all discounts available for the purchase of mail order prescription drugs. The following amounts are
eliminated in consolidation in connection with the item (ii) intersegment activity: net revenues of $4.3 billion, $3.4 billion and $2.6 billion for the years
ended December 31, 2013, 2012 and 2011, respectively; gross profit and operating profit of $566 million, $411 million and $186 million for the
years ended December 31, 2013, 2012 and 2011, respectively.