CVS 2013 Annual Report Download - page 31
Download and view the complete annual report
Please find page 31 of the 2013 CVS annual report below. You can navigate through the pages in the report by either clicking on the pages listed below, or by using the keyword search tool below to find specific information within the annual report.-
 1
1 -
2
-
3
-
4
-
5
-
6
-
7
-
8
-
9
-
10
-
11
-
12
-
13
-
14
-
15
-
16
-
17
-
18
-
19
-
20
-
 21
21 -
 22
22 -
 23
23 -
 24
24 -
 25
25 -
 26
26 -
 27
27 -
 28
28 -
 29
29 -
 30
30 -
 31
31 -
 32
32 -
 33
33 -
 34
34 -
 35
35 -
 36
36 -
 37
37 -
 38
38 -
 39
39 -
 40
40 -
 41
41 -
42
-
43
-
44
-
45
-
46
-
47
-
48
-
49
-
50
-
51
-
52
-
53
-
54
-
55
-
56
-
57
-
58
-
59
-
60
-
61
-
62
-
63
-
64
-
65
-
66
-
67
-
68
-
69
-
70
-
71
-
72
-
73
-
74
-
75
-
76
-
77
-
78
-
79
-
80
-
81
-
82
-
83
-
84
-
85
-
86
-
87
-
88
-
89
-
90
-
91
-
92
-
93
-
94
-
95
-
96
 |
 |

29
2013 Annual Report
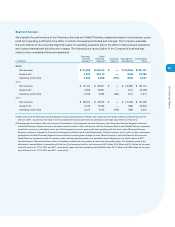
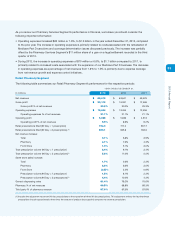
Segment Analysis
We evaluate the performance of our Pharmacy Services and Retail Pharmacy segments based on net revenues, gross
profit and operating profit before the effect of certain intersegment activities and charges. The Company evaluates
the performance of its Corporate Segment based on operating expenses before the effect of discontinued operations
and certain intersegment activities and charges. The following is a reconciliation of the Company’s business seg-
ments to the consolidated financial statements:
Pharmacy Retail
Services Pharmacy Corporate Intersegment Consolidated
In millions
Segment (1) (2) Segment (2) Segment Eliminations (2) Totals
2013:
Net revenues
$ 76,208 $ 65,618 $ — $ (15,065) $ 126,761
Gross profit
4,237 20,112 — (566) 23,783
Operating profit (loss)
3,086 6,268 (751) (566) 8,037
2012:
Net revenues $ 73,444 $ 63,641 $ — $ (13,965) $ 123,120
Gross profit 3,808 19,091 — (411) 22,488
Operating profit (loss) 2,679 5,636 (694) (411) 7,210
2011:
Net revenues $ 58,874 $ 59,579 $ — $ (11,373) $ 107,080
Gross profit 3,279 17,469 — (186) 20,562
Operating profit (loss) 2,220 4,913 (616) (186) 6,331
(1) Net revenues of the Pharmacy Services Segment include approximately $7.9 billion, $8.4 billion and $7.9 billion of Retail Co-Payments for 2013,
2012 and 2011, respectively. See Note 1 to the consolidated financial statements for additional information about Retail Co-Payments.
(2) Intersegment eliminations relate to two types of transactions: (i) Intersegment revenues that occur when Pharmacy Services Segment customers
use Retail Pharmacy Segment stores to purchase covered products. When this occurs, both the Pharmacy Services and Retail Pharmacy segments
record the revenue on a standalone basis, and (ii) Intersegment revenues, gross profit and operating profit that occur when Pharmacy Services
Segment customers, through the Company’s intersegment activities (such as the Maintenance Choice® program), elect to pick-up their maintenance
prescriptions at Retail Pharmacy Segment stores instead of receiving them through the mail. When this occurs, both the Pharmacy Services and
Retail Pharmacy segments record the revenue, gross profit and operating profit on a standalone basis. Beginning in the fourth quarter of 2011,
the Maintenance Choice eliminations reflect all discounts available for the purchase of mail order prescription drugs. The following amounts are
eliminated in consolidation in connection with the item (ii) intersegment activity: net revenues of $4.3 billion, $3.4 billion and $2.6 billion for the years
ended December 31, 2013, 2012 and 2011, respectively; gross profit and operating profit of $566 million, $411 million and $186 million for the years
ended December 31, 2013, 2012 and 2011, respectively.