CVS 2013 Annual Report Download - page 29
Download and view the complete annual report
Please find page 29 of the 2013 CVS annual report below. You can navigate through the pages in the report by either clicking on the pages listed below, or by using the keyword search tool below to find specific information within the annual report.-
 1
1 -
2
-
3
-
4
-
5
-
6
-
7
-
8
-
9
-
10
-
11
-
12
-
13
-
14
-
15
-
16
-
17
-
18
-
 19
19 -
 20
20 -
 21
21 -
 22
22 -
 23
23 -
 24
24 -
 25
25 -
 26
26 -
 27
27 -
 28
28 -
 29
29 -
 30
30 -
 31
31 -
 32
32 -
 33
33 -
 34
34 -
 35
35 -
 36
36 -
 37
37 -
 38
38 -
 39
39 -
40
-
41
-
42
-
43
-
44
-
45
-
46
-
47
-
48
-
49
-
50
-
51
-
52
-
53
-
54
-
55
-
56
-
57
-
58
-
59
-
60
-
61
-
62
-
63
-
64
-
65
-
66
-
67
-
68
-
69
-
70
-
71
-
72
-
73
-
74
-
75
-
76
-
77
-
78
-
79
-
80
-
81
-
82
-
83
-
84
-
85
-
86
-
87
-
88
-
89
-
90
-
91
-
92
-
93
-
94
-
95
-
96
 |
 |

27
2013 Annual Report
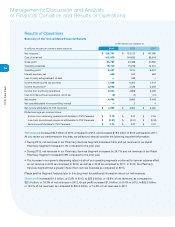
• During 2013, gross profit in our Pharmacy Services Segment and Retail Pharmacy Segment increased by 11.3%
and 5.3%, respectively, compared to the prior year. For the year ended December 31, 2013, gross profit as a
percent of net revenues in our Pharmacy Services Segment and Retail Pharmacy Segment was 5.6% and 30.6%,
respectively.
• During 2012, gross profit in our Pharmacy Services Segment and Retail Pharmacy Segment increased by 16.1%
and 9.3%, respectively, compared to the prior year. For the year ended December 31, 2012, gross profit as a
percent of net revenues in our Pharmacy Services Segment and Retail Pharmacy Segment was 5.2% and 30.0%,
respectively.
• The increased weighting toward the Pharmacy Services Segment, which has a lower gross profit than the Retail
Pharmacy Segment, resulted in a decline in consolidated gross profit as a percent of net revenues in 2012 as
compared to 2011. In addition, gross profit for 2013, 2012 and 2011 has been negatively impacted by the efforts of
managed care organizations, pharmacy benefit managers and governmental and other third-party payors to reduce
their prescription drug costs.
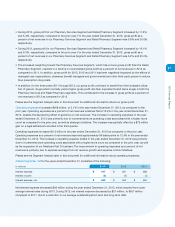
• In addition, for the three years 2011 through 2013, our gross profit continued to benefit from the increased utiliza-
tion of generic drugs (which normally yield a higher gross profit rate than equivalent brand name drugs) in both the
Pharmacy Services and Retail Pharmacy segments. This contributed to the increase in gross profit as a percent of
net revenues in 2013 as compared to 2012.
Please see the Segment Analysis later in this document for additional information about our gross profit.
Operating expenses
increased $468 million, or 3.1% in the year ended December 31, 2013, as compared to the
prior year. Operating expenses as a percent of net revenues remained flat at 12.4% in the year ended December 31,
2013, despite the dampening effect of generics on net revenues. The increase in operating expenses in the year
ended December 31, 2013 was primarily due to incremental store operating costs associated with a higher store
count as compared to the prior year, as well as strategic initiatives. The increase was partially offset by a $72 million
gain on a legal settlement recorded in the third quarter.
Operating expenses increased $1.0 billion in the year ended December 31, 2012 as compared to the prior year.
Operating expenses as a percent of net revenues improved approximately 90 basis points to 12.4% in the year ended
December 31, 2012. The increase in operating expense dollars in the year ended December 31, 2012 was primarily
due to incremental store operating costs associated with a higher store count as compared to the prior year, as well
as the expansion of our Medicare Part D business. The improvement in operating expenses as a percent of net
revenues is primarily due to expense leverage from net revenue growth and expense control initiatives.
Please see the Segment Analysis later in this document for additional information about operating expenses.
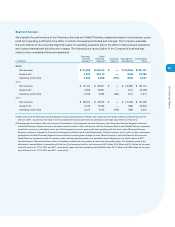
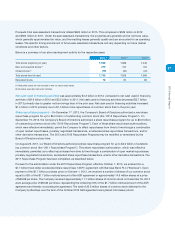
Interest expense, net
for the years ended December 31 consisted of the following:
In millions
2013 2012 2011
Interest expense
$ 517
$ 561 $ 588
Interest income
(8)
(4) (4)
Interest expense, net
$ 509
$ 557 $ 584
Net interest expense decreased $48 million during the year ended December 31, 2013, which resulted from lower
average interest rates during 2013. During 2012, net interest expense decreased by $27 million, to $557 million
compared to 2011, due to a reduction in our average outstanding short-term and long-term debt.