CVS 2013 Annual Report Download - page 16
Download and view the complete annual report
Please find page 16 of the 2013 CVS annual report below. You can navigate through the pages in the report by either clicking on the pages listed below, or by using the keyword search tool below to find specific information within the annual report.-
 1
1 -
2
-
3
-
4
-
5
-
 6
6 -
 7
7 -
 8
8 -
 9
9 -
 10
10 -
 11
11 -
 12
12 -
 13
13 -
 14
14 -
 15
15 -
 16
16 -
 17
17 -
 18
18 -
 19
19 -
 20
20 -
 21
21 -
 22
22 -
 23
23 -
 24
24 -
 25
25 -
 26
26 -
27
-
28
-
29
-
30
-
31
-
32
-
33
-
34
-
35
-
36
-
37
-
38
-
39
-
40
-
41
-
42
-
43
-
44
-
45
-
46
-
47
-
48
-
49
-
50
-
51
-
52
-
53
-
54
-
55
-
56
-
57
-
58
-
59
-
60
-
61
-
62
-
63
-
64
-
65
-
66
-
67
-
68
-
69
-
70
-
71
-
72
-
73
-
74
-
75
-
76
-
77
-
78
-
79
-
80
-
81
-
82
-
83
-
84
-
85
-
86
-
87
-
88
-
89
-
90
-
91
-
92
-
93
-
94
-
95
-
96
 |
 |

14
CVS Caremark
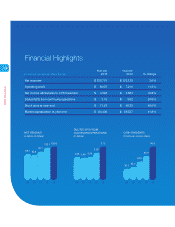
Net revenues $ 126,761 $ 123,120 3.0%
Operating profit $ 8,037 $ 7,210 11.5%
Net income attributable to CVS Caremark $ 4,592 $ 3,864 18.8%
Diluted EPS from continuing operations $ 3.75 $ 3.02 24.0%
Stock price at year-end $ 71.57 $ 48.35 48.0%
Market capitalization at year-end $ 84,436 $ 59,527 41.8%
Financial Highlights
fiscal year fiscal year
(in millions, except per share figures) 2013 2012 % change
NET REVENUE
(in billions of dollars)
126.8
123.1
107.1
95.8
98.1
09 10 11 12 13
3.75
3.02
2.59
2.49
2.55
09 10 11 12 13
DILUTED EPS FROM
CONTINUING OPERATIONS
(in dollars)
90.0
65.0
50.0
35.0
30.5
09 10 11 12 13
CASH DIVIDENDS
(in cents per common share)