CVS 2013 Annual Report Download - page 80
Download and view the complete annual report
Please find page 80 of the 2013 CVS annual report below. You can navigate through the pages in the report by either clicking on the pages listed below, or by using the keyword search tool below to find specific information within the annual report.-
 1
1 -
2
-
3
-
4
-
5
-
6
-
7
-
8
-
9
-
10
-
11
-
12
-
13
-
14
-
15
-
16
-
17
-
18
-
19
-
20
-
21
-
22
-
23
-
24
-
25
-
26
-
27
-
28
-
29
-
30
-
31
-
32
-
33
-
34
-
35
-
36
-
37
-
38
-
39
-
40
-
41
-
42
-
43
-
44
-
45
-
46
-
47
-
48
-
49
-
50
-
51
-
52
-
53
-
54
-
55
-
56
-
57
-
58
-
59
-
60
-
61
-
62
-
63
-
64
-
65
-
66
-
67
-
68
-
69
-
 70
70 -
 71
71 -
 72
72 -
 73
73 -
 74
74 -
 75
75 -
 76
76 -
 77
77 -
 78
78 -
 79
79 -
 80
80 -
 81
81 -
 82
82 -
 83
83 -
 84
84 -
 85
85 -
 86
86 -
 87
87 -
 88
88 -
 89
89 -
 90
90 -
91
-
92
-
93
-
94
-
95
-
96
 |
 |

78
CVS Caremark
Notes to Consolidated Financial Statements
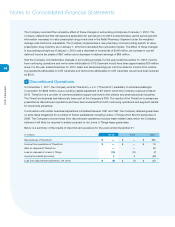
In May 2010, the Company’s Board of Directors adopted and the shareholders approved the 2010 Incentive
Compensation Plan (the “2010 ICP”). The terms of the 2010 ICP provide for grants of annual incentive and long-term
performance awards to executive officers and other officers and employees of the Company or any subsidiary of the
Company. Payment of such annual incentive and long-term performance awards will be in cash, stock, other awards
or other property, at the discretion of the Management Planning and Development Committee of the Company’s
Board of Directors. The 2010 ICP allows for a maximum of 74 million shares to be reserved and available for grants.
The 2010 ICP is the only compensation plan under which the Company grants stock options, restricted stock and
other stock-based awards to its employees, with the exception of the Company’s 2007 ESPP. In November 2012, the
Company’s Board of Director’s approved an amendment to the 2010 ICP to eliminate the share recycling provision of
the 2010 ICP. As of December 31, 2013, there were approximately 38 million shares available for future grants under
the 2010 ICP.
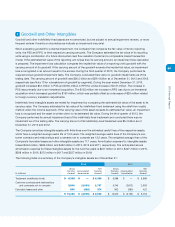
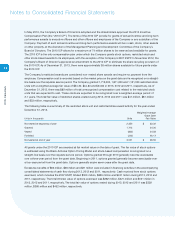
The Company’s restricted awards are considered non-vested share awards and require no payment from the
employee. Compensation cost is recorded based on the market price on the grant date and is recognized on a straight-
line basis over the requisite service period. The Company granted 1,715,000, 1,811,000 and 1,121,000 restricted stock
units with a weighted average fair value of $54.30, $44.80 and $34.84 in 2013, 2012 and 2011, respectively. As of
December 31, 2013, there was $89 million of total unrecognized compensation cost related to the restricted stock
units that are expected to vest. These costs are expected to be recognized over a weighted-average period of
2.1 years. The total fair value of restricted shares vested during 2013, 2012 and 2011 was $41 million, $81 million
and $33 million, respectively.
The following table is a summary of the restricted stock unit and restricted share award activity for the year ended
December 31, 2013.
Weighted Average
Grant Date
Units in thousands
Units Fair Value
Nonvested at beginning of year 2,350 $ 33.32
Granted 1,715 54.30
Vested (802) 54.58
Forfeited (242) 46.17
Nonvested at end of year 3,021 $ 38.56
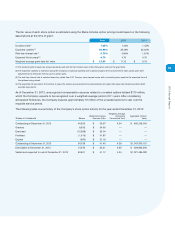
All grants under the 2010 ICP are awarded at fair market value on the date of grant. The fair value of stock options
is estimated using the Black-Scholes Option Pricing Model and stock-based compensation is recognized on a
straight-line basis over the requisite service period. Options granted through 2010 generally become exercisable
over a three-year period from the grant date. Beginning in 2011, options granted generally become exercisable over
a four-year period from the grant date. Options generally expire seven years after the grant date.
Excess tax benefits of $62 million, $28 million and $21 million were included in financing activities in the accompanying
consolidated statements of cash flow during 2013, 2012 and 2011, respectively. Cash received from stock options
exercised, which includes the 2007 ESPP, totaled $500 million, $836 million and $431 million during 2013, 2012 and
2011, respectively. The total intrinsic value of options exercised was $282 million, $321 million and $161 million in
2013, 2012 and 2011, respectively. The total fair value of options vested during 2013, 2012 and 2011 was $329
million, $386 million and $452 million, respectively.