Asus 2013 Annual Report Download - page 98
Download and view the complete annual report
Please find page 98 of the 2013 Asus annual report below. You can navigate through the pages in the report by either clicking on the pages listed below, or by using the keyword search tool below to find specific information within the annual report.-
 1
1 -
2
-
3
-
4
-
5
-
6
-
7
-
8
-
9
-
10
-
11
-
12
-
13
-
14
-
15
-
16
-
17
-
18
-
19
-
20
-
21
-
22
-
23
-
24
-
25
-
26
-
27
-
28
-
29
-
30
-
31
-
32
-
33
-
34
-
35
-
36
-
37
-
38
-
39
-
40
-
41
-
42
-
43
-
44
-
45
-
46
-
47
-
48
-
49
-
50
-
51
-
52
-
53
-
54
-
55
-
56
-
57
-
58
-
59
-
60
-
61
-
62
-
63
-
64
-
65
-
66
-
67
-
68
-
69
-
70
-
71
-
72
-
73
-
74
-
75
-
76
-
77
-
78
-
79
-
80
-
81
-
82
-
83
-
84
-
85
-
86
-
87
-
 88
88 -
 89
89 -
 90
90 -
 91
91 -
 92
92 -
 93
93 -
 94
94 -
 95
95 -
 96
96 -
 97
97 -
 98
98 -
 99
99 -
 100
100 -
 101
101 -
 102
102 -
 103
103 -
 104
104 -
 105
105 -
 106
106 -
 107
107 -
 108
108 -
109
-
110
-
111
-
112
-
113
-
114
-
115
-
116
-
117
-
118
-
119
-
120
-
121
-
122
-
123
-
124
-
125
-
126
-
127
-
128
-
129
-
130
-
131
-
132
-
133
-
134
-
135
-
136
-
137
-
138
-
139
-
140
-
141
-
142
-
143
-
144
-
145
-
146
-
147
 |
 |

94
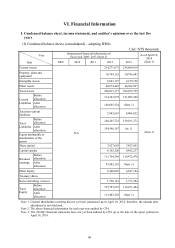
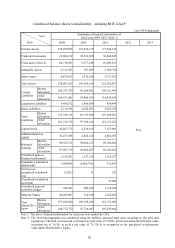
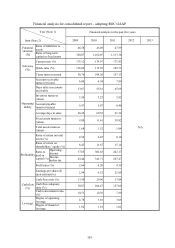
(II) Condensed balance sheets (separate) – adopting IFRSs
Unit: NT$ thousands
Year
Item
Summarized Balance sheets of
fiscal year 2009~2013 (Note 2) As of
April 19, 2014
2009 2010 2011 2012 2013
Current Assets
N/A
130,453,670 130,087,168
(Note 3)
Property, plant and
equipment 4,002,107 4,440,336
Intangible Assets 110,730 313,928
Other Assets 72,784,708 86,063,086
Total Assets 207,351,215 220,904,518
Current
Liabilities
Before
allocation 75,803,458 78,436,223
After
allocation 90,105,903 (Note 1)
Total non-current liabilities 5,550,283 7,268,793
Total
Liabilities
Before
allocation 81,353,741 85,705,016
After
allocation 95,656,186 (Note 1)
Share capital 7,527,603 7,427,603
Capital surplus 4,305,220 4,452,237
Retained
earnings
Before
allocation 111,704,586 116,472,478
After
allocation 97,402,141 (Note 1)
Other Equity 2,460,065 6,847,184
Treasury shares - -
Total Equity
Before
allocation 125,997,474 135,199,502
After
allocation 111,695,029 (Note 1)
Note 1: General shareholders meeting has not yet been summoned up to April 19, 2014; therefore, the amount
after adjustment is not disclosed
Note 2: The above financial information for each year was audited by CPA.
Note 3: The 2014Q1 financial statements have not yet been audited by CPA up to the date of the report printed on
April 19, 2014.