Asus 2013 Annual Report Download - page 116
Download and view the complete annual report
Please find page 116 of the 2013 Asus annual report below. You can navigate through the pages in the report by either clicking on the pages listed below, or by using the keyword search tool below to find specific information within the annual report.-
 1
1 -
2
-
3
-
4
-
5
-
6
-
7
-
8
-
9
-
10
-
11
-
12
-
13
-
14
-
15
-
16
-
17
-
18
-
19
-
20
-
21
-
22
-
23
-
24
-
25
-
26
-
27
-
28
-
29
-
30
-
31
-
32
-
33
-
34
-
35
-
36
-
37
-
38
-
39
-
40
-
41
-
42
-
43
-
44
-
45
-
46
-
47
-
48
-
49
-
50
-
51
-
52
-
53
-
54
-
55
-
56
-
57
-
58
-
59
-
60
-
61
-
62
-
63
-
64
-
65
-
66
-
67
-
68
-
69
-
70
-
71
-
72
-
73
-
74
-
75
-
76
-
77
-
78
-
79
-
80
-
81
-
82
-
83
-
84
-
85
-
86
-
87
-
88
-
89
-
90
-
91
-
92
-
93
-
94
-
95
-
96
-
97
-
98
-
99
-
100
-
101
-
102
-
103
-
104
-
105
-
 106
106 -
 107
107 -
 108
108 -
 109
109 -
 110
110 -
 111
111 -
 112
112 -
 113
113 -
 114
114 -
 115
115 -
 116
116 -
 117
117 -
 118
118 -
 119
119 -
 120
120 -
 121
121 -
 122
122 -
 123
123 -
 124
124 -
 125
125 -
 126
126 -
127
-
128
-
129
-
130
-
131
-
132
-
133
-
134
-
135
-
136
-
137
-
138
-
139
-
140
-
141
-
142
-
143
-
144
-
145
-
146
-
147
 |
 |

112
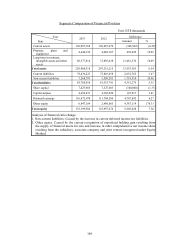
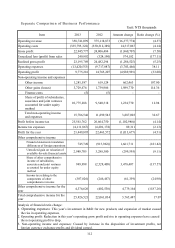
Separate Comparison of Business Performance
Unit: NT$ thousands
Item 2013 2012 Amount change Ratio change (%)
Operating revenue 358,741,099 375,118,873 (16,377,774) (4.37)
Operating costs (335,795,322) (350,312,389) 14,517,067 (4.14)
Gross profit 22,945,777 24,806,484 (1,860,707) (7.50)
Unrealized loss (profit) from sales 249,992 (324,190) 574,182 (177.11)
Realized gross profit 23,195,769 24,482,294 (1,286,525) (5.25)
Operating expenses (13,420,553) (9,717,087) (3,703,466) 38.11
Operating profit 9,775,216 14,765,207 (4,989,991) (33.80)
Non-operating income and expenses
Other income 1,281,587 619,124 662,463 107.00
Other gains (losses) 3,729,676 1,739,906 1,989,770 114.36
Finance costs (5) (5) - -
Share of profit of subsidiaries,
associates and joint ventures
accounted for under equity
method
10,775,288 9,540,518 1,234,770 12.94
Total non-operating income
and expenses 15,786,546 11,899,543 3,887,003 32.67
Profit before income tax 25,561,762 26,664,750 (1,102,988)) (4.14)
Income tax expenses (4,111,867) (4,201,178) 89,311 (2.13)
Profit for the year 21,449,895 22,463,572 (1,013,677) (4.51)
Other comprehensive income
Financial statements translation
differences of foreign operations 745,749 (915,962)) 1,661,711 (181.42)
Unrealized gain on valuation of
available-for-sale financial assets 2,988,705 3,288,300 (299,595) (9.11)
Share of other comprehensive
income of subsidiaries,
associates and joint ventures
accounted for under equity
method
949,998 (2,528,409) 3,478,407 (137.57)
Income tax relating to the
components of other
comprehensive income
(307,826) (246,467) (61,359) (24.90)
Other comprehensive income for the
year 4,376,626 (402,538) 4,779,164 (1187.26)
Total comprehensive income for the
year 25,826,521 22,061,034 3,765,487 17.07
Analysis of financial ratio change:
1. Operating expenses: This year’s investment in R&D for new products and expansion of market caused
the rise in operating expenses.
2. Operating profit: Reduction in this year’s operating grow profit and rise in operating expenses have caused
the net operating profit to drop.
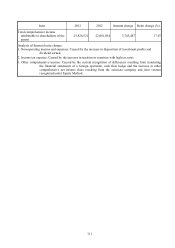
3. Non-operating income and expenses: Caused by increase in the disposition of investment profits, net
foreign currency exchange profits and dividend earned.