Asus 2013 Annual Report Download - page 96
Download and view the complete annual report
Please find page 96 of the 2013 Asus annual report below. You can navigate through the pages in the report by either clicking on the pages listed below, or by using the keyword search tool below to find specific information within the annual report.-
 1
1 -
2
-
3
-
4
-
5
-
6
-
7
-
8
-
9
-
10
-
11
-
12
-
13
-
14
-
15
-
16
-
17
-
18
-
19
-
20
-
21
-
22
-
23
-
24
-
25
-
26
-
27
-
28
-
29
-
30
-
31
-
32
-
33
-
34
-
35
-
36
-
37
-
38
-
39
-
40
-
41
-
42
-
43
-
44
-
45
-
46
-
47
-
48
-
49
-
50
-
51
-
52
-
53
-
54
-
55
-
56
-
57
-
58
-
59
-
60
-
61
-
62
-
63
-
64
-
65
-
66
-
67
-
68
-
69
-
70
-
71
-
72
-
73
-
74
-
75
-
76
-
77
-
78
-
79
-
80
-
81
-
82
-
83
-
84
-
85
-
 86
86 -
 87
87 -
 88
88 -
 89
89 -
 90
90 -
 91
91 -
 92
92 -
 93
93 -
 94
94 -
 95
95 -
 96
96 -
 97
97 -
 98
98 -
 99
99 -
 100
100 -
 101
101 -
 102
102 -
 103
103 -
 104
104 -
 105
105 -
 106
106 -
107
-
108
-
109
-
110
-
111
-
112
-
113
-
114
-
115
-
116
-
117
-
118
-
119
-
120
-
121
-
122
-
123
-
124
-
125
-
126
-
127
-
128
-
129
-
130
-
131
-
132
-
133
-
134
-
135
-
136
-
137
-
138
-
139
-
140
-
141
-
142
-
143
-
144
-
145
-
146
-
147
 |
 |
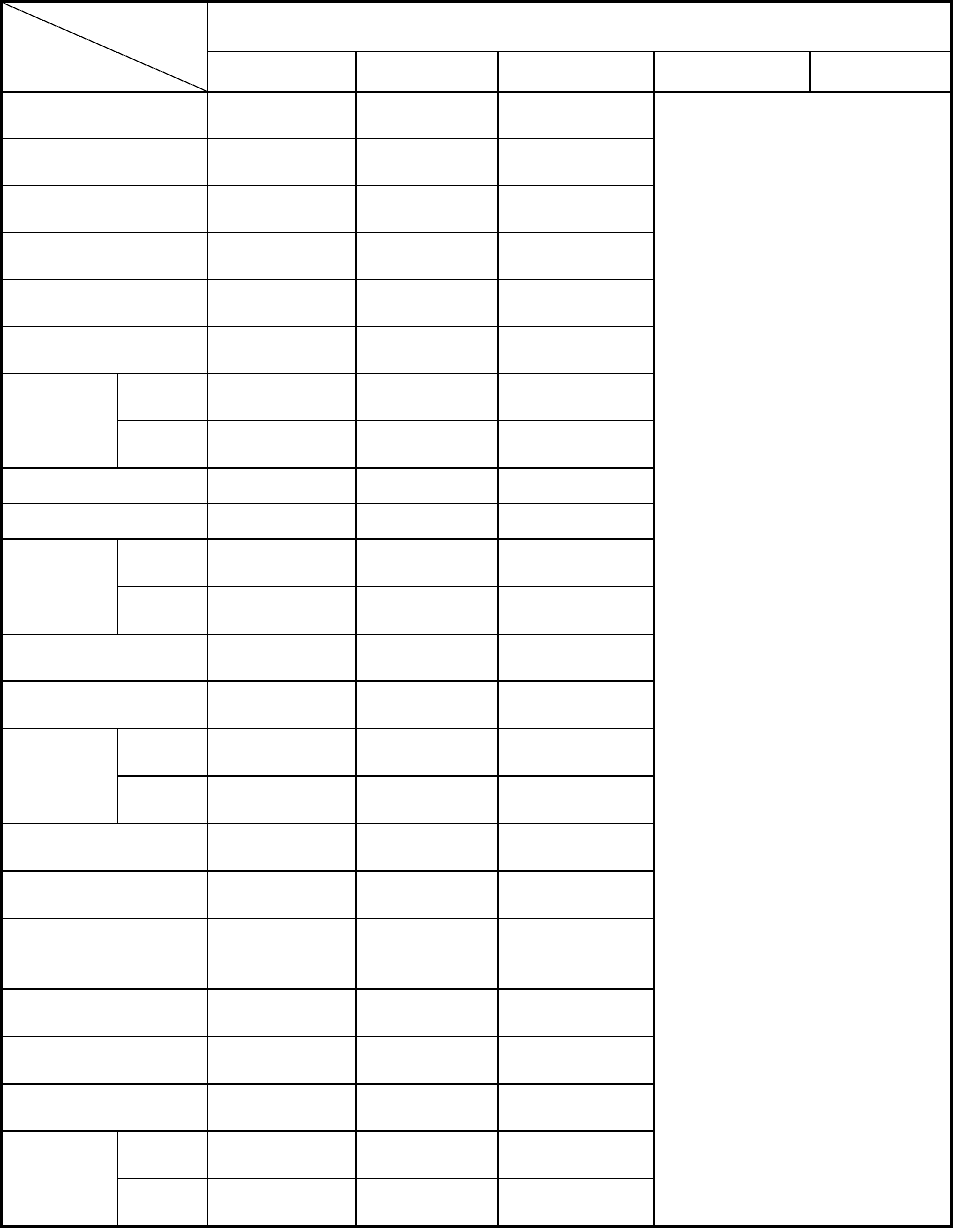
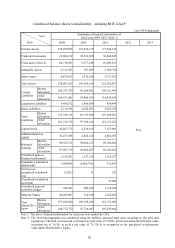
92
Condensed balance sheets (consolidated) – adopting ROC GAAP
Unit: NT$ thousands
Year
Item
Summarized financial information of
fiscal year 2009~2013 (Note 1)
2009 2010 2011 2012 2013
Current Assets 278,290,995 153,450,175 177,644,110
N/A
Funds & investments 12,804,912 30,141,020 30,486,345
Fixed assets (Note 2) 64,716,905 9,277,818 10,509,523
Intangible Assets 4,319,475 367,069 2,369,754
Other Assets 9,874,815 1,870,106 2,373,255
Total Assets 370,007,102 195,106,188 223,382,987
Current
Liabilities
Before
allocation 160,753,370 85,266,601 103,321,085
After
allocation 169,671,602 93,904,834 114,236,109
Long-term Liabilities 9,486,372 1,456,500 834,498
Other Liabilities 2,116,396 2,024,807 3,052,718
Total
Liabilities
Before
allocation 172,356,138 88,747,908 107,208,301
After
allocation 181,274,370 97,386,141 118,123,325
Capital Stock 42,467,775 6,270,166 7,527,603
Additional paid-in
capital 30,237,586 4,482,124 4,662,555
Retained
earnings
Before
allocation 96,525,371 94,960,135 99,100,280
After
allocation 87,607,139 84,964,465 88,185,256
Unrealized gain on
financial instruments 2,159,201 1,197,335 1,514,237
Cumulative translation
adjustments 1,490,885 (1,066,766) 715,457
Net loss not
recognized as pension
cost
(3,202) 11 122
Unrealized revaluation
increment - - 73,526
Unrealized gains on
cash flow hedges 306,361 200,655 1,354,470
Minority Equity 24,466,987 314,620 1,226,436
Total
Shareholder’s
Equity
Before
allocation 197,650,964 106,358,280 116,174,686
After
allocation 188,732,732 97,720,047 105,259,662
Note 1: The above financial information for each year was audited by CPA.
Note 2: The 2010 land appraisal was conducted using the publicly assessed land value according to the laws and
regulations. The land was assessed to increase in total value of 91,909, which was deducted with land value
increment tax of 18,381 to yield a net value of 73,526. It is recognized as the unrealized re-assessment
value under Shareholder’s Equity.