Asus 2013 Annual Report Download - page 84
Download and view the complete annual report
Please find page 84 of the 2013 Asus annual report below. You can navigate through the pages in the report by either clicking on the pages listed below, or by using the keyword search tool below to find specific information within the annual report.-
 1
1 -
2
-
3
-
4
-
5
-
6
-
7
-
8
-
9
-
10
-
11
-
12
-
13
-
14
-
15
-
16
-
17
-
18
-
19
-
20
-
21
-
22
-
23
-
24
-
25
-
26
-
27
-
28
-
29
-
30
-
31
-
32
-
33
-
34
-
35
-
36
-
37
-
38
-
39
-
40
-
41
-
42
-
43
-
44
-
45
-
46
-
47
-
48
-
49
-
50
-
51
-
52
-
53
-
54
-
55
-
56
-
57
-
58
-
59
-
60
-
61
-
62
-
63
-
64
-
65
-
66
-
67
-
68
-
69
-
70
-
71
-
72
-
73
-
 74
74 -
 75
75 -
 76
76 -
 77
77 -
 78
78 -
 79
79 -
 80
80 -
 81
81 -
 82
82 -
 83
83 -
 84
84 -
 85
85 -
 86
86 -
 87
87 -
 88
88 -
 89
89 -
 90
90 -
 91
91 -
 92
92 -
 93
93 -
 94
94 -
95
-
96
-
97
-
98
-
99
-
100
-
101
-
102
-
103
-
104
-
105
-
106
-
107
-
108
-
109
-
110
-
111
-
112
-
113
-
114
-
115
-
116
-
117
-
118
-
119
-
120
-
121
-
122
-
123
-
124
-
125
-
126
-
127
-
128
-
129
-
130
-
131
-
132
-
133
-
134
-
135
-
136
-
137
-
138
-
139
-
140
-
141
-
142
-
143
-
144
-
145
-
146
-
147
 |
 |

80
Most of the aforementioned manufacturers have been doing business with ASUS for
years.
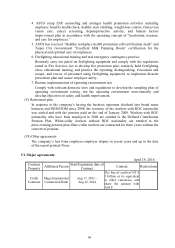
(IV) Major Customers with over 10% net sales and Suppliers with over 10% total purchases
of the last two fiscal years
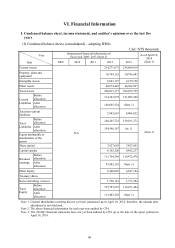
1. Major Suppliers of the last two fiscal years
Unit: NT$ thousands
2011 2012 2014Q1 (Note 1)
Item Name Amount
Percentage of
net annual
purchase (%)
Relation
with
issuer
Name Amount
Percentage of
net annual
purchase (%)
Relation
with
issuer
Name Amount
Percentage of
net purchase
of Q1 (%)
Relatio
n with
issuer
1 PEGA
131,662,808 24
Invested
company
valued
with
equity
method
PEGA 85,227,822 18
Available
-for-Sale
Financial
Assets
2 T customer 92,514,581 17 None T customer 92,945,629 20 None
3 F customer 75,626,026 14 None F customer 68,088,647 14 None
4 Others
246,770,368 45 Others
228,611,238 48 Others
Net
purchase
amount
546,573,783 100
Net
purchase
amount
474,873,336 100
Net
purchase
amount
100
Note 1: The 2013Q1 financial statements audited by the CPA were not yet available up to the print of annual
report on April 19, 2014.
Note 2: The purchase amount from the last two years included raw material amount purchased for clients.
Note 3: Causes of increase and decrease – for business operation
2. Major Customers of the last two fiscal years
Unit: NT$ thousands
2012 2013 2014Q1
(Note 1)
Item Name Amount
Percentage
of annual
net sales
(%)
Relation with
issuer Name Amount
Percentage
of annual
net sales
(%)
Relation
with issuer Name Amount
Percentage
of net sales
of Q1 (%)
Relati
on
with
issuer
1 ASTP 353,448,218 94
Invested
company
valued with
equity method
ASTP 233,229,291 65
Invested
company
valued with
equity
method
2 Others 21,670,655 6 ASGL 105,733,214 29
Invested
company
valued with
equity
method
Others
Others 19,778,594 6 Others
Net sales
amount 375,118,873 100 Net sales
amount 358,741,099 100
Net
sales
amount
Note 1: The 2014Q1 financial statements audited by the CPA were not yet available up to the print of annual
report on April 19, 2014.
Note 2: Causes of increase and decrease – for business operation